Joining Data in QGIS
Getting Started
Note: This tutorial uses data downloaded from Los Angeles Open Data portal (see: Quick Visual Guide to Visualizing Data on LA Open Data Portal)
Download QGIS if you do not have it installed: http://www.qgis.org/en/site/forusers/download.html ~~~~~~~~~~~~~~~~~~~~~~~~~~~~~~~~~~~~~~~~~~~~~~~~~~~~
Next download the following datasets:
http://boundaries.latimes.com/1.0/boundary-set/la-county-neighborhoods-v5/?format=shphttp://sandbox.idre.ucla.edu/mapshare/data/usa/census/Los_Angeles_ZipCodes.zip
Most GIS files (also called shapefiles) will be in a zipped format, so be sure to unzip them!
Mac Example:https://asmand.files.wordpress.com/2015/09/unzip-mac.gif
PC Example:https://www.youtube.com/watch?v=ZQOYqzGHiDY
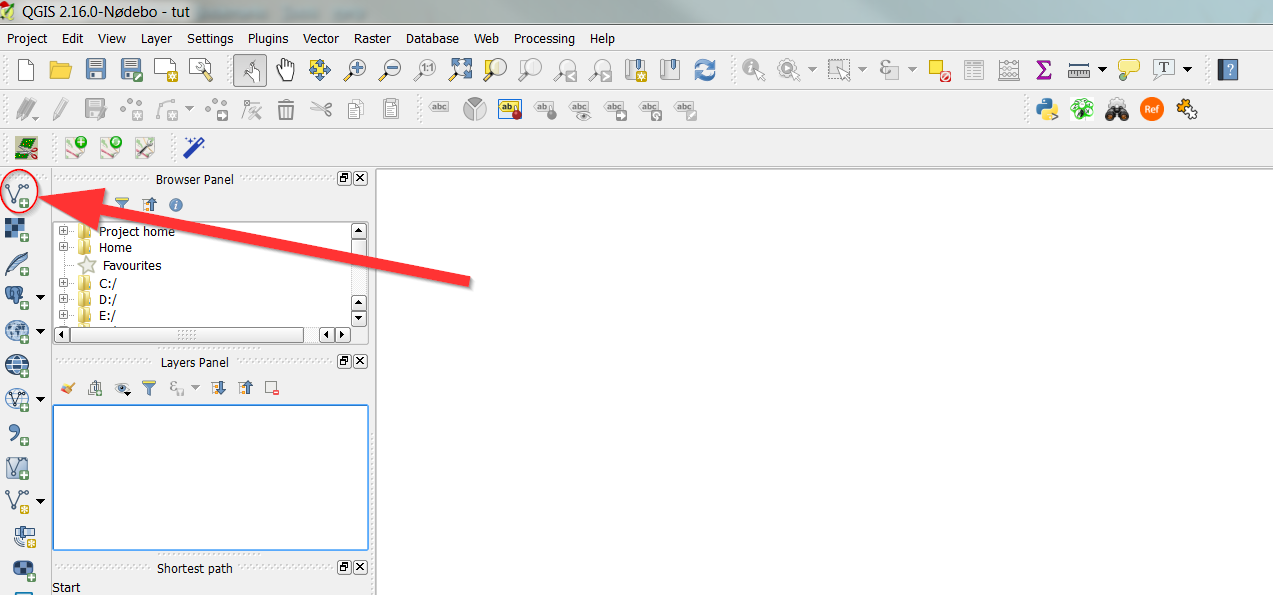
How to add vector data
- Click the weird V to the left of the main menu
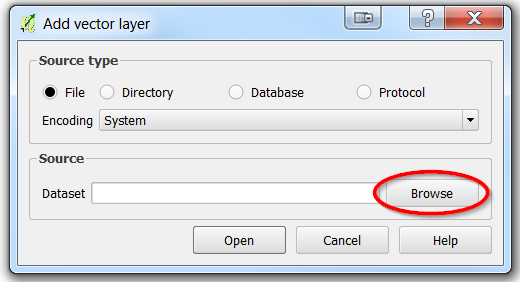
- Click Browse
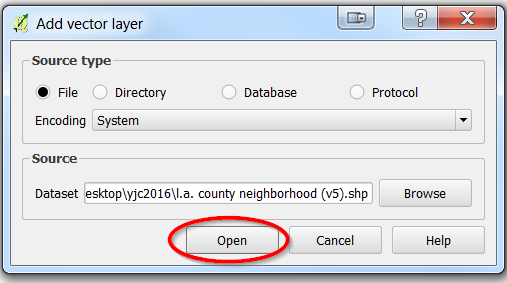
- Find the “l.a county neighborhood (v5).shp” file and click “Open”
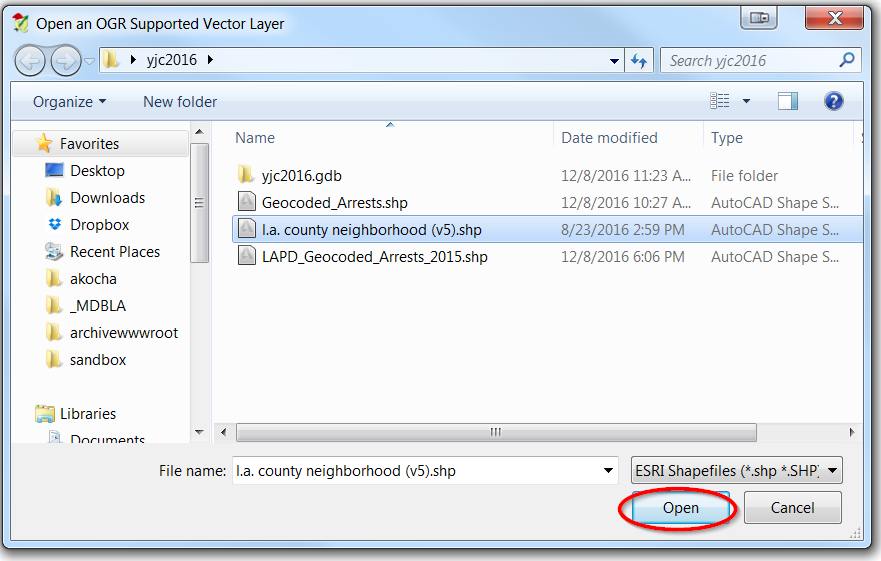
- Now select open
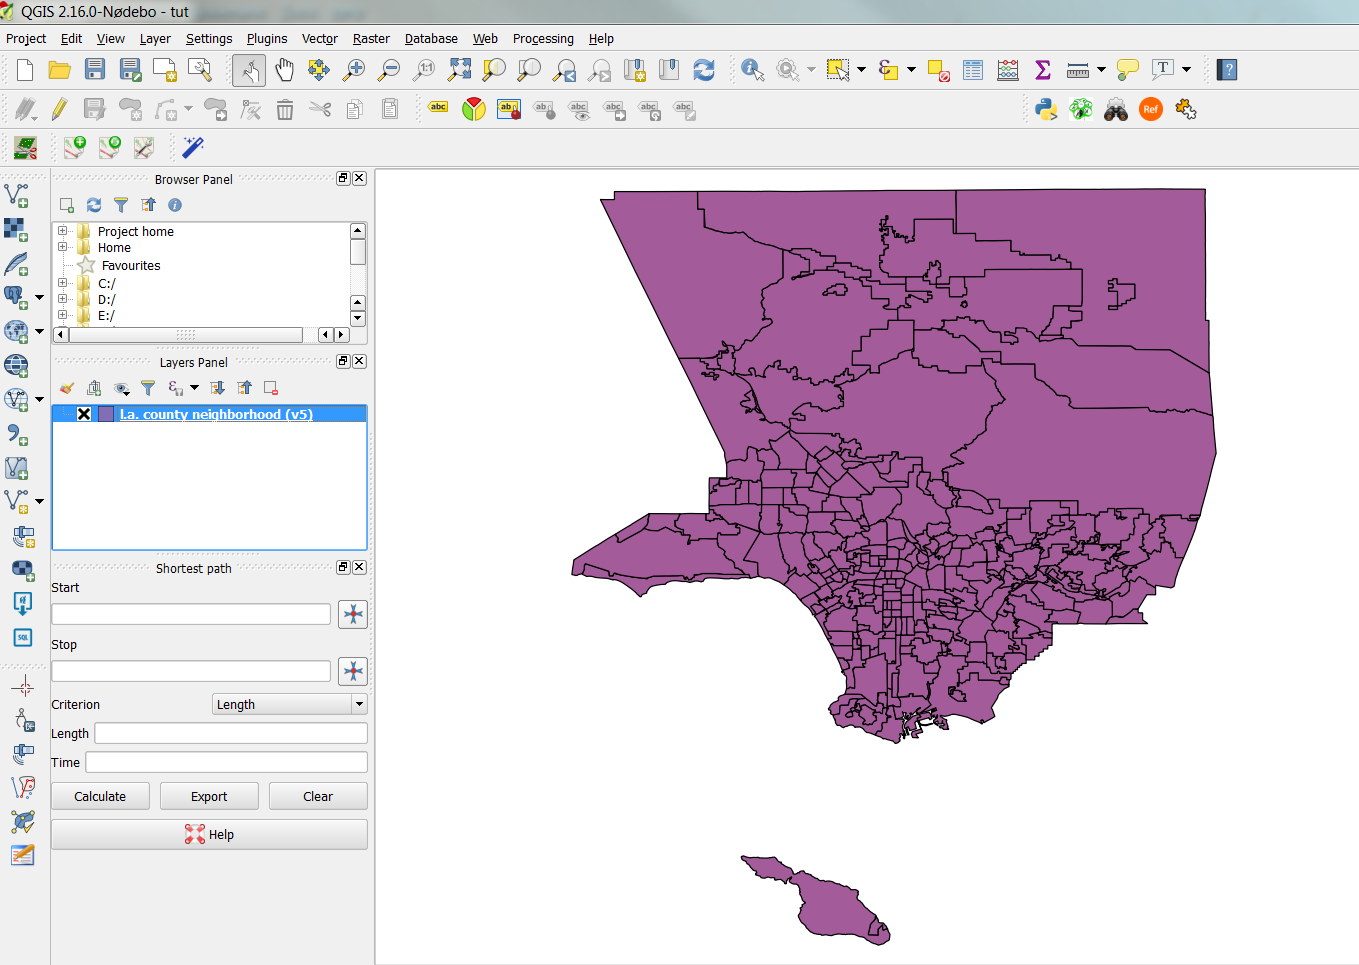
- Now the vector file should show up in the window:
Working with layers:
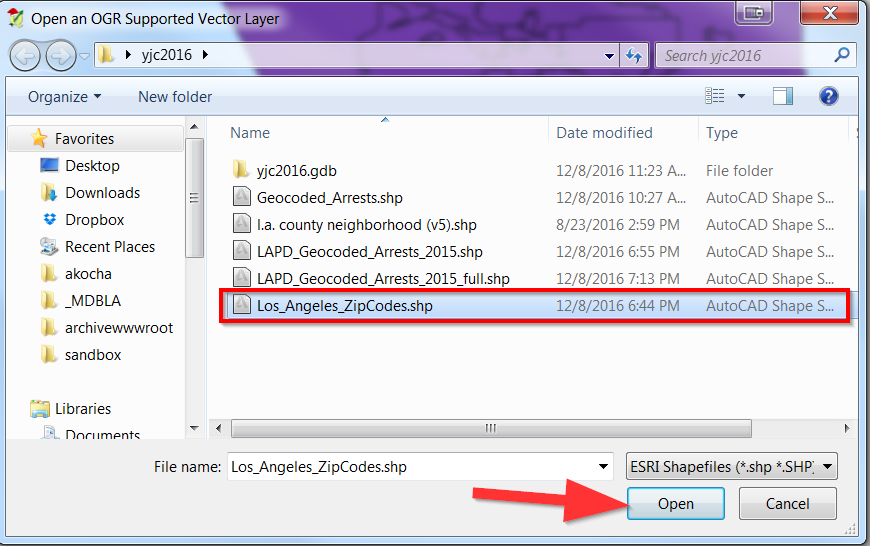
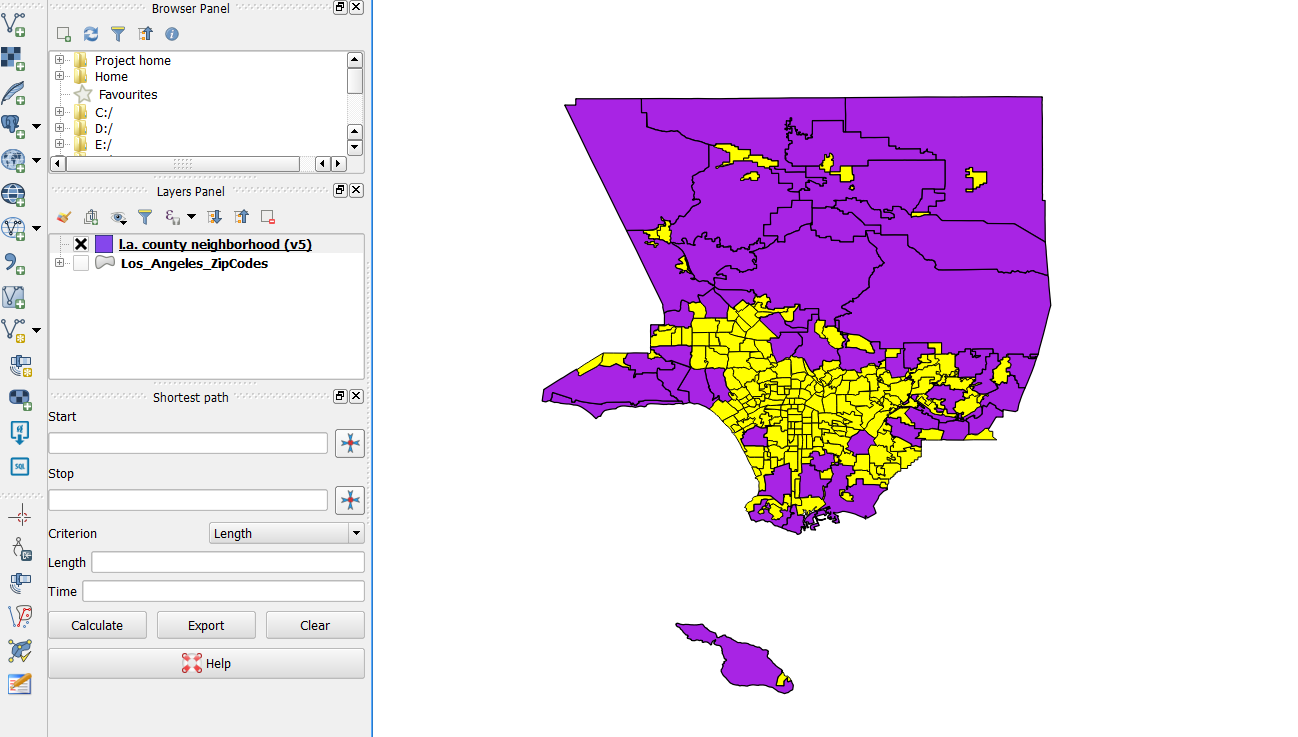
- Let’s add another GIS file called Los_Angeles_ZipCodes
- Notice what happens right after you add it:
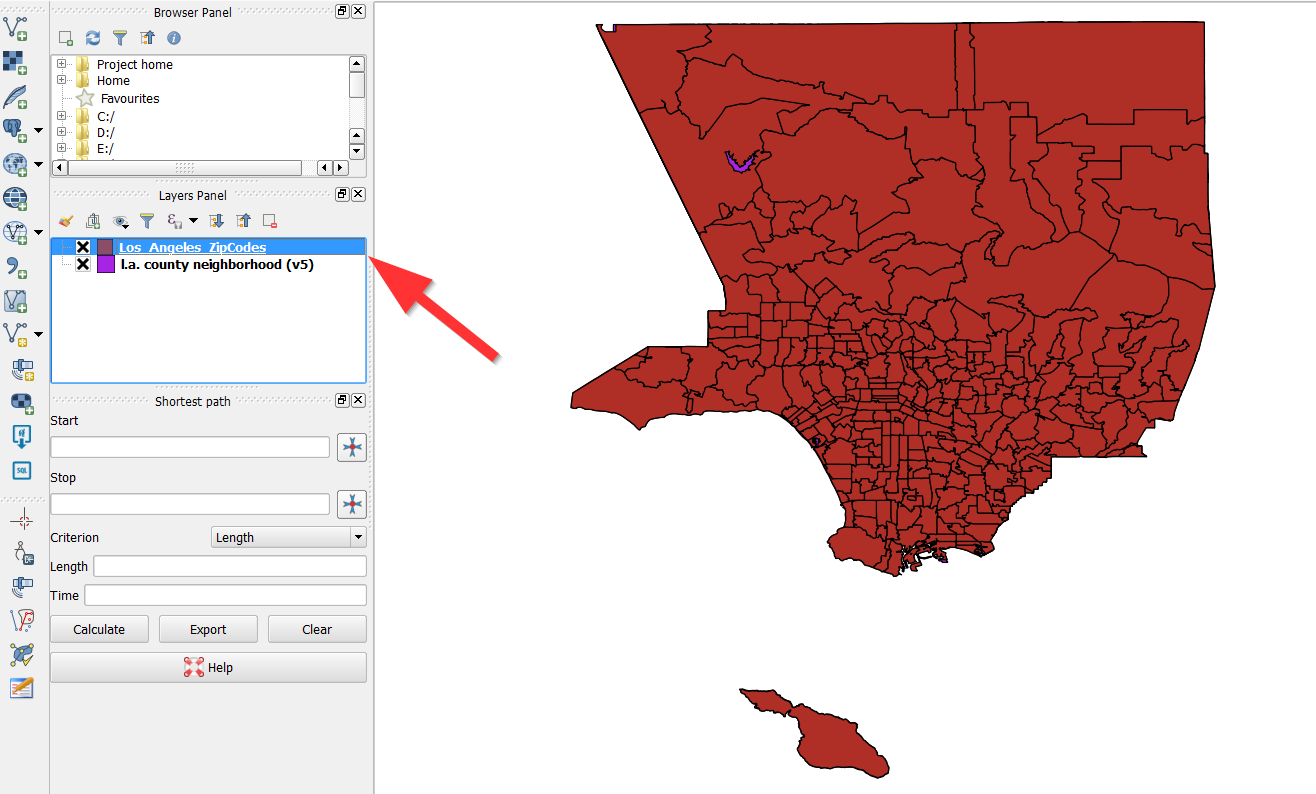
It appears on top of the La county neighborhood (v5) layer which masks it from view.
- If you hit the box with the X you can toggle it on and off.
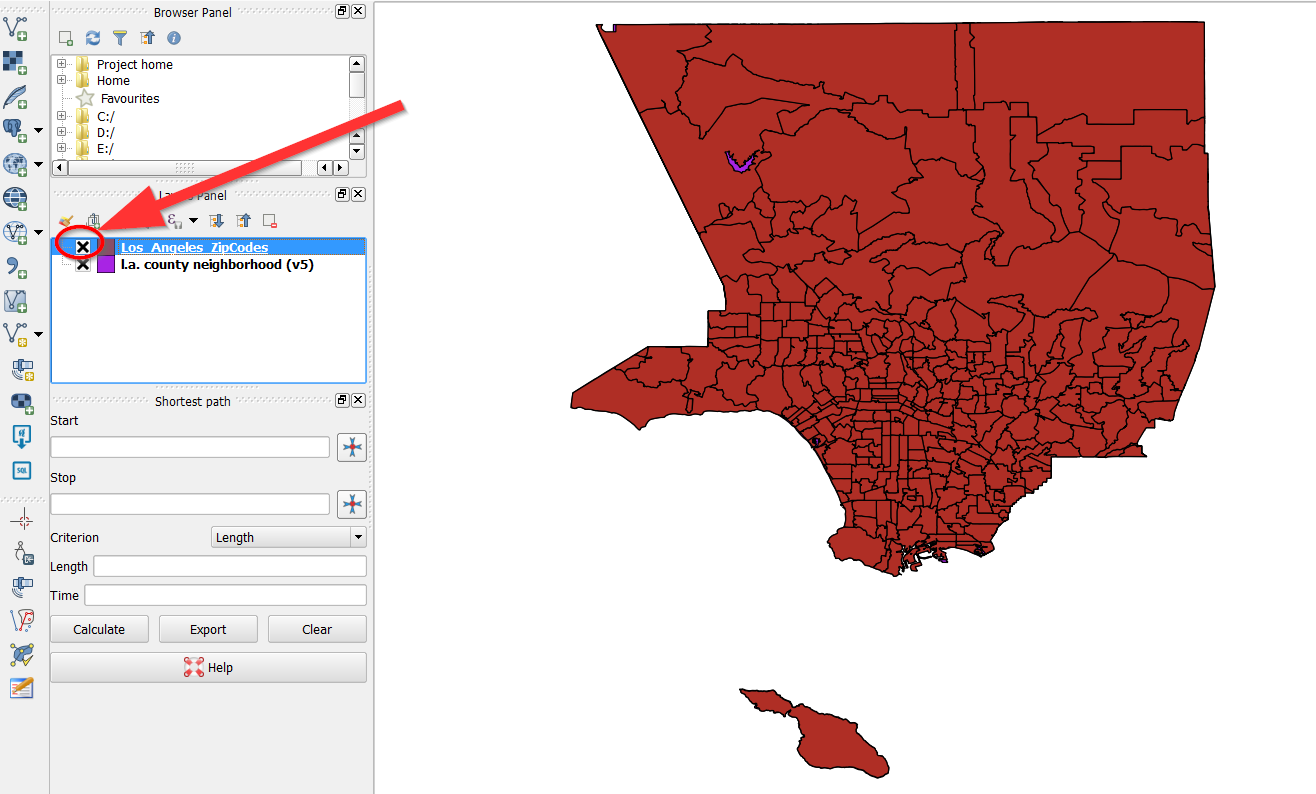
- You can also drag the layer up and down.
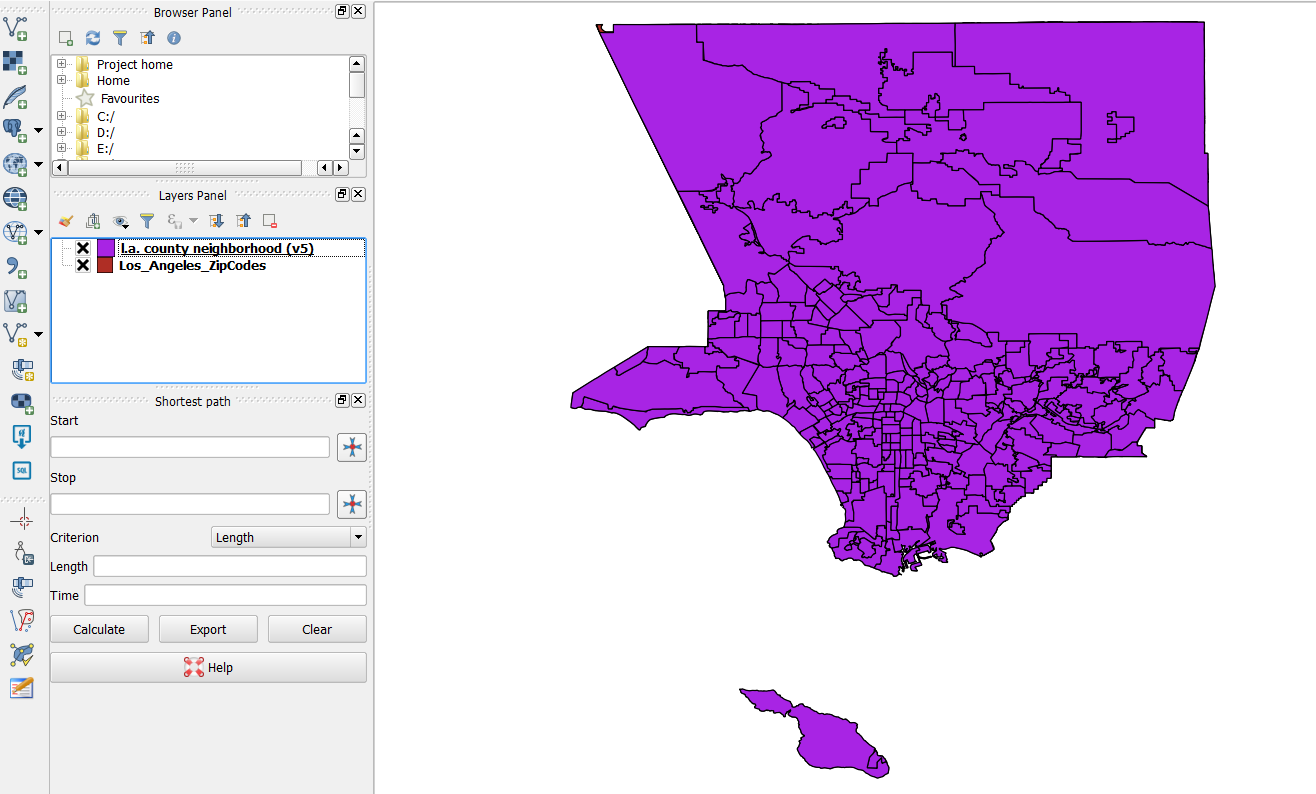
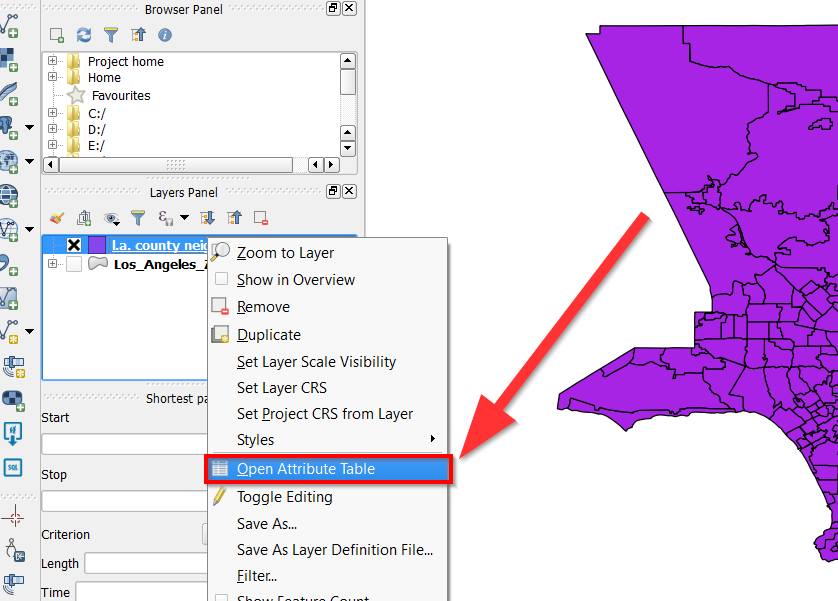
You can right click or cmd + click on the layer to do various things, such as open an attribute table, remove the layer, or copy it.

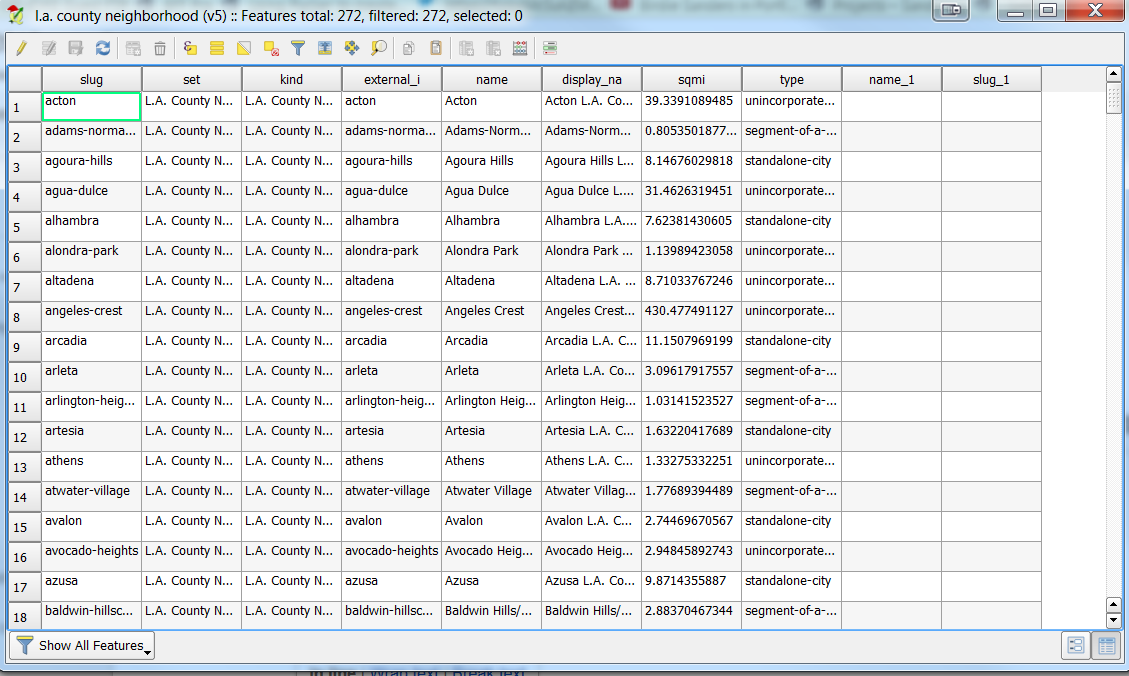
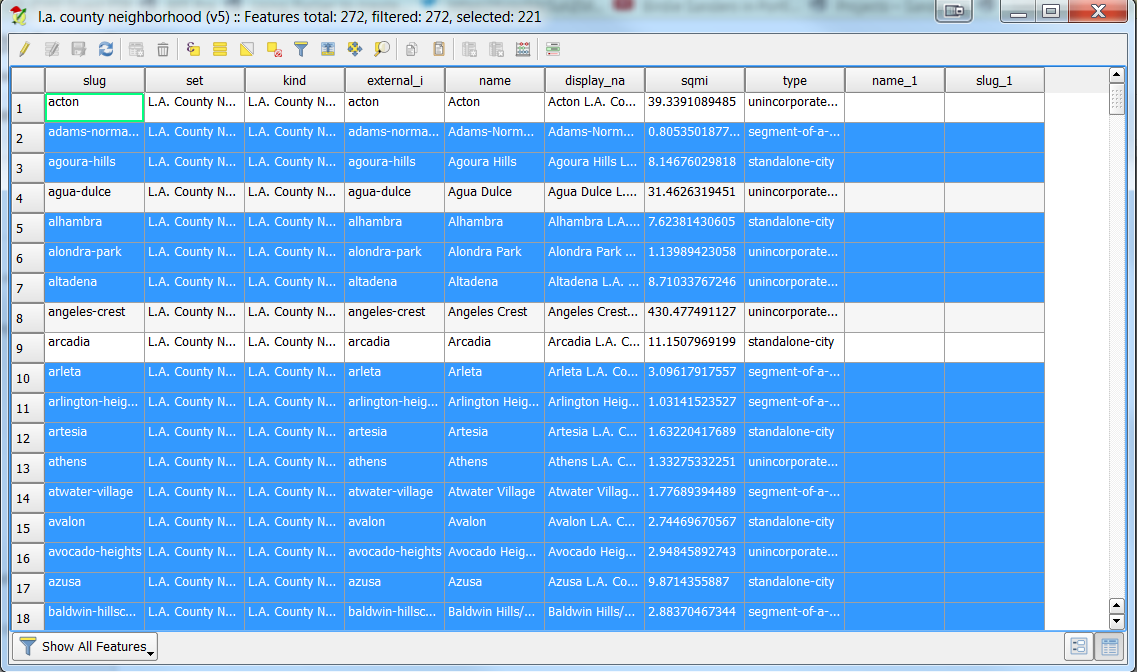
Let’s click on “Open Attribute Table”:
- Here you can see all the data that is stored in the file:
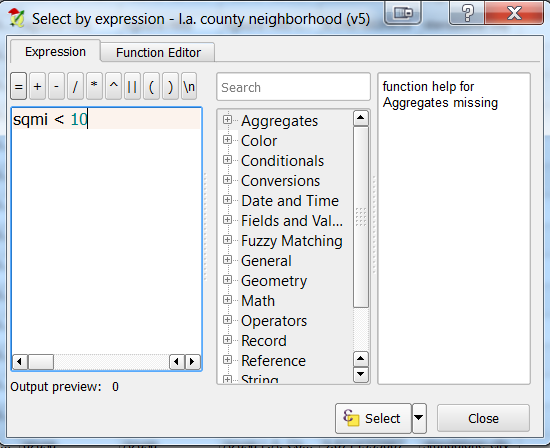
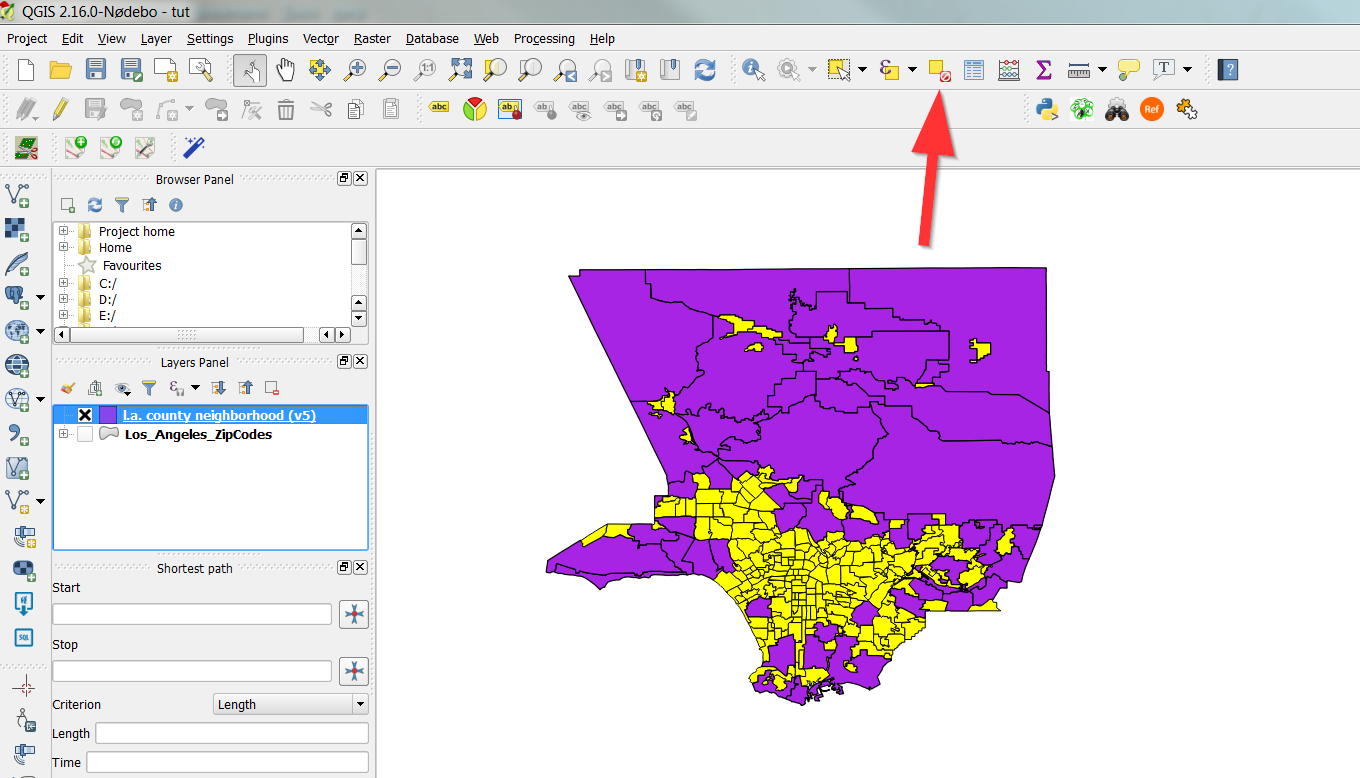
- You can also filter the data to show only certain things by using
- the expression calculator:

- For example, you can see neighborhoods with less than 10 square
- miles large, by using “sqmi < 10”
- Both in the table and map, the yellow rows are what is less than 10 square miles:
- You can clear the selection by clicking clear:
- If you want, you can go ahead and remove the layer if you’d like.
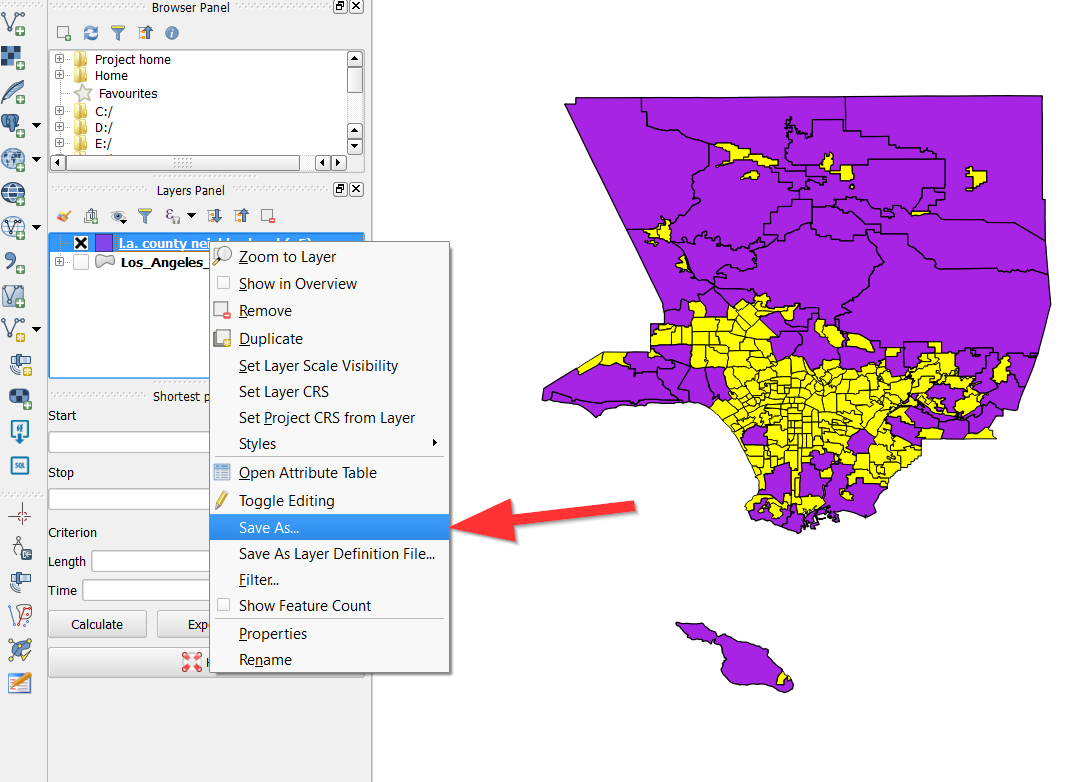
Taking data out of QGIS
Sometimes you want to take data out of QGIS to manipulate it in other software, such as Excel. You can do so, by opening the layer properties and clicking save as:
You can now choose a file type and name, make sure to select “CSV”:

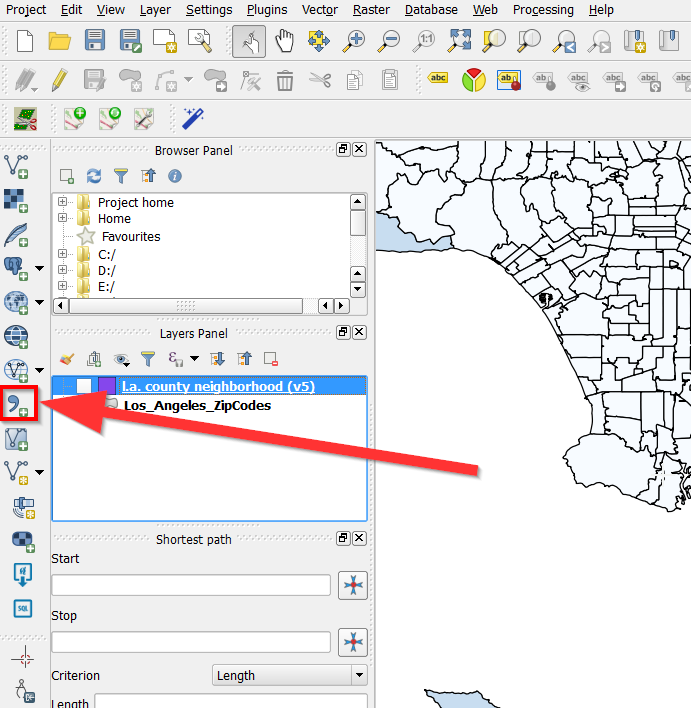
Add a CSV file in QGIS
Start by clicking the comma:
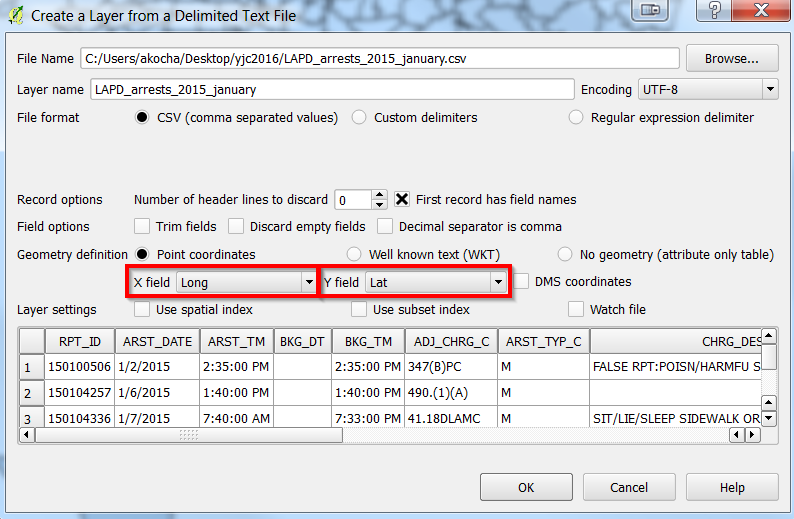
After finding the file, a new dialogue box will show up. Be sure to have Lat and Long selected for the X and Y values [X is always Longitude and Y is always Latitude]:
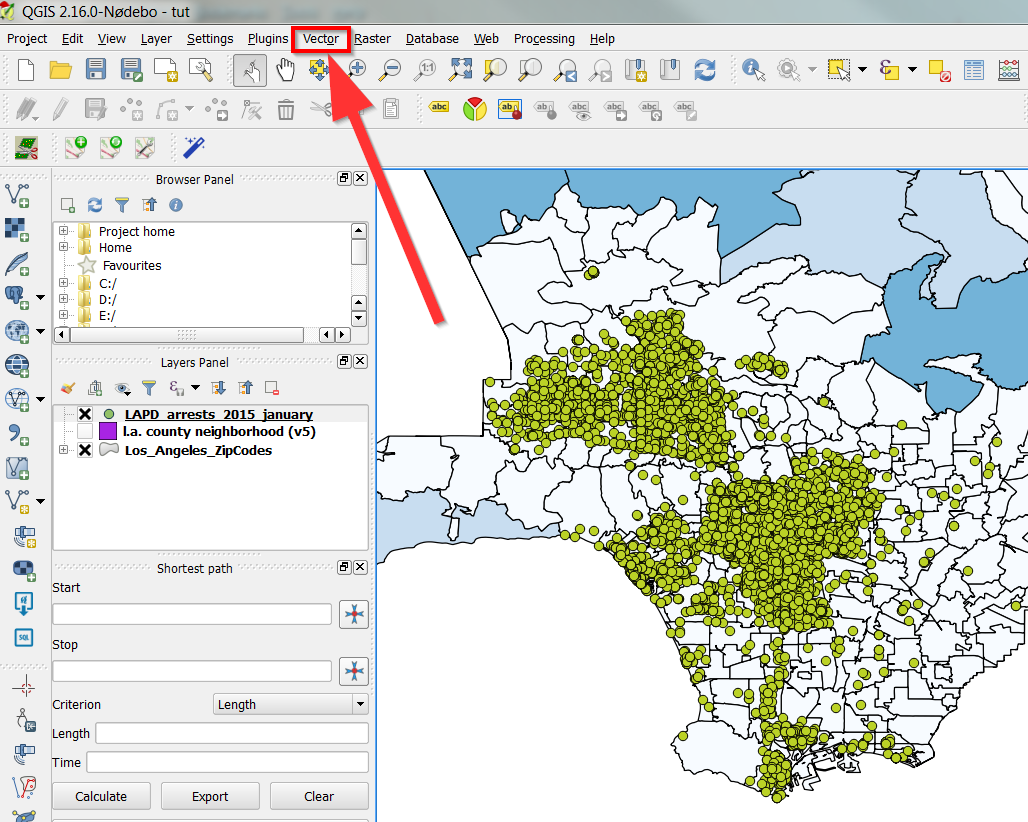
Spatial Joining Data
- Make sure you have the two layers you want to join together, in this case the LAPD_arrests_2015_january.csv and the Los_Angeles_ZipCodes.
- Go to Vector in the menu
- Then Data Management
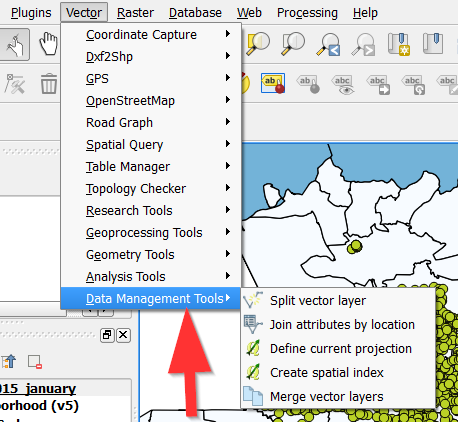
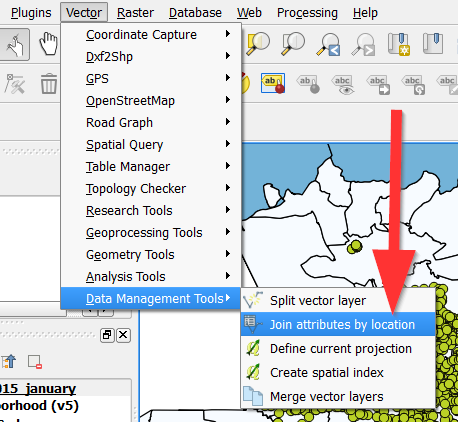
- Then Join Attributes by Location
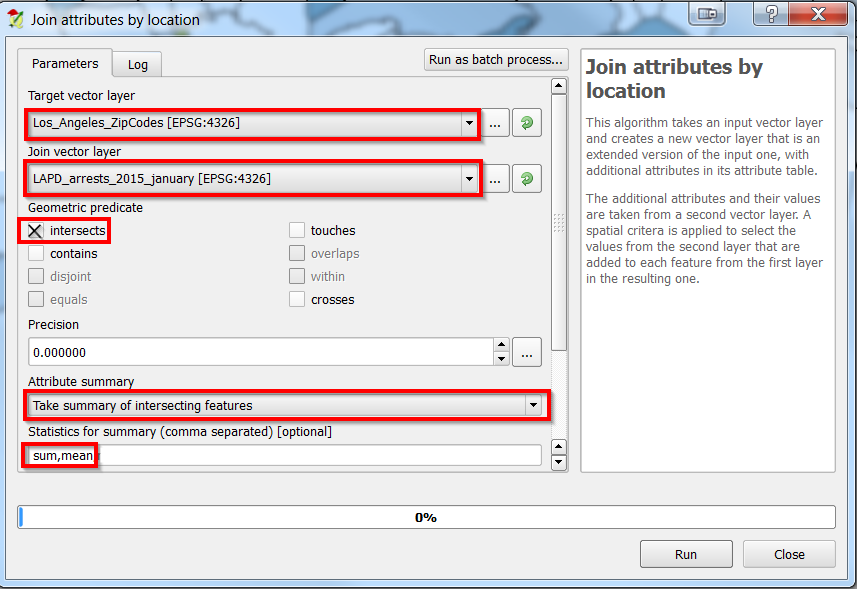
5. The target layer should be the layer you want the data to go towards, the join layer is the layer you are taking the information from. So in this case, the Target is the Los Angeles ZipCodes, while the Join is the LAPD_arrests_2015_january.
- Make sure to choose “Intersects” for the Geometric Predicate.
- Be sure to select “Take a summary of Intersecting Features” and you only need “sum” and “mean” for the Statistics field.
- Your text box should look like the following:
- Click “Run” to run the join.
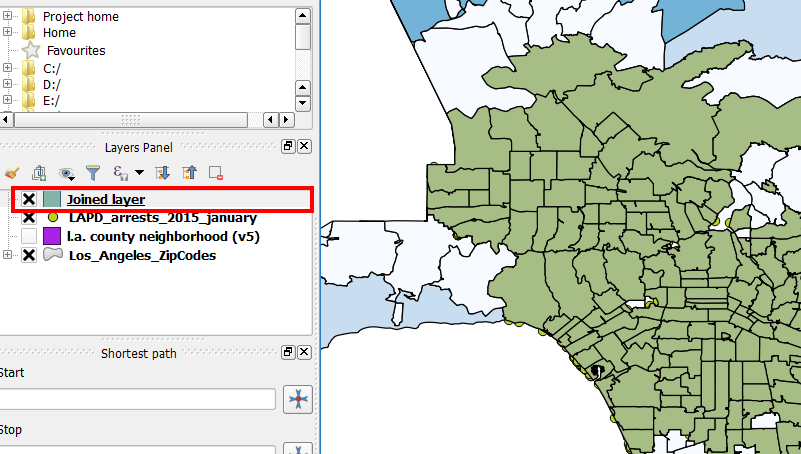
- A new layer called “Joined Layer” should show up:
- Go ahead and open the attribute table and see if the “sum” worked!
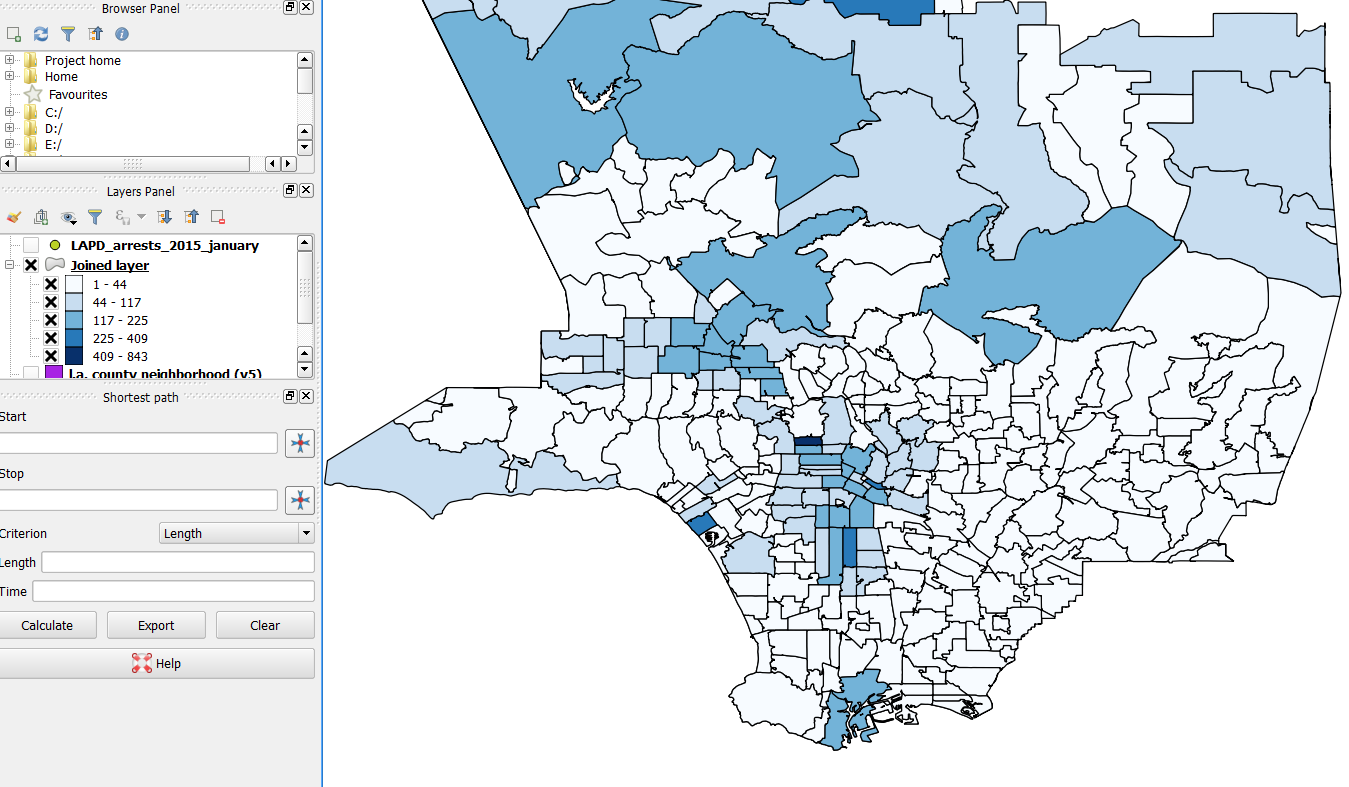
- Try and visualize the data like so:
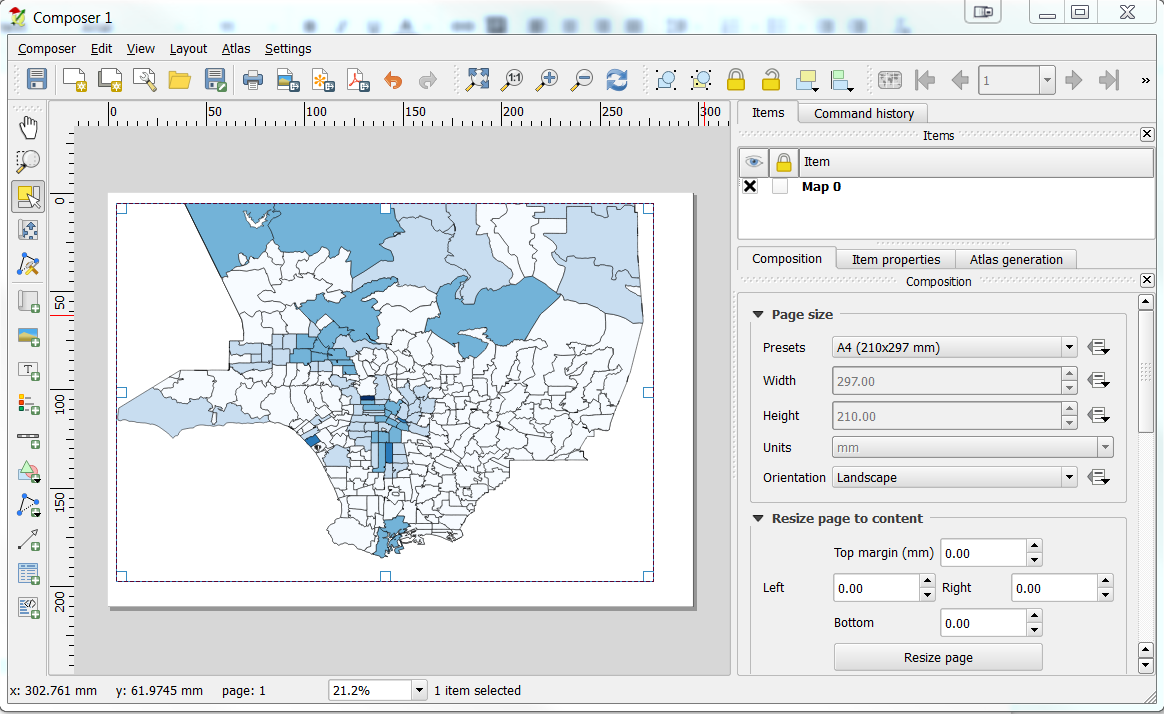
Exporting a map
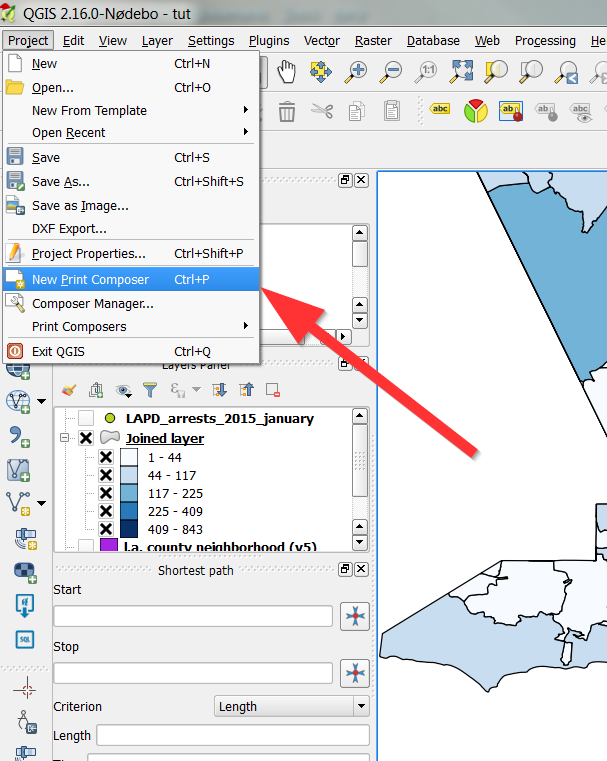
QGIS has a tool called “Print Composer” to take care of all your map printing needs. You can find it by going to “File” then “New Print Composer”
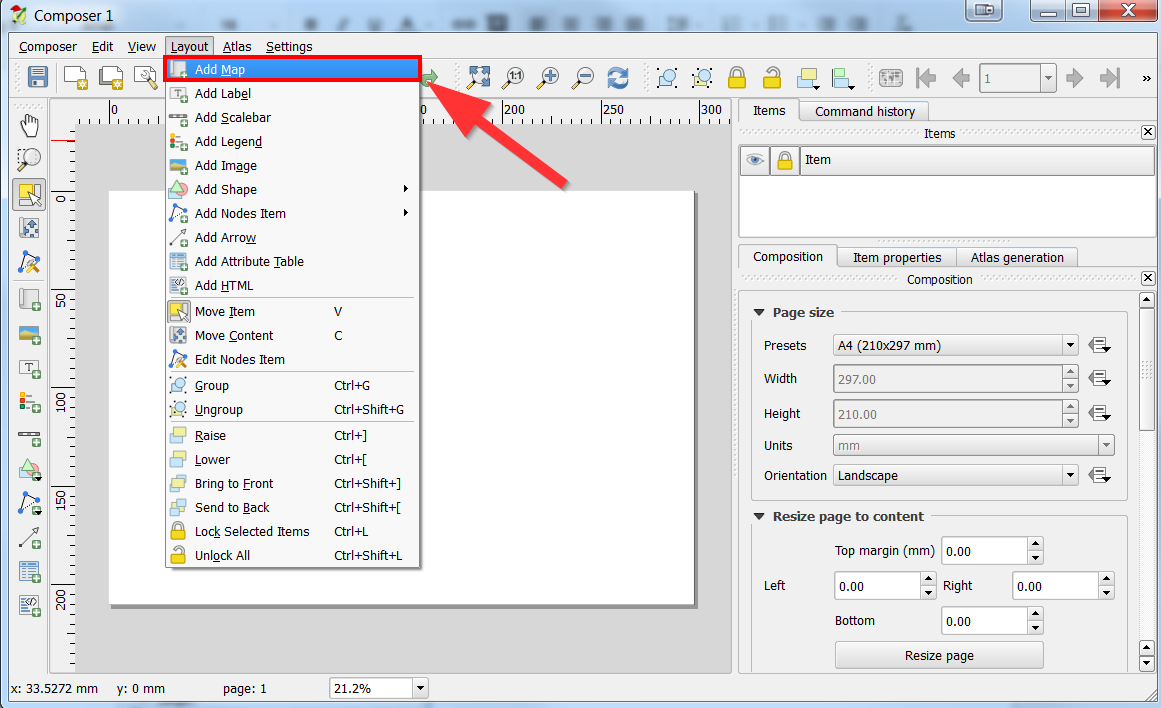
After opening a new print composer, you should add a map, which can by done by going to “Layout” then “Add new map”:
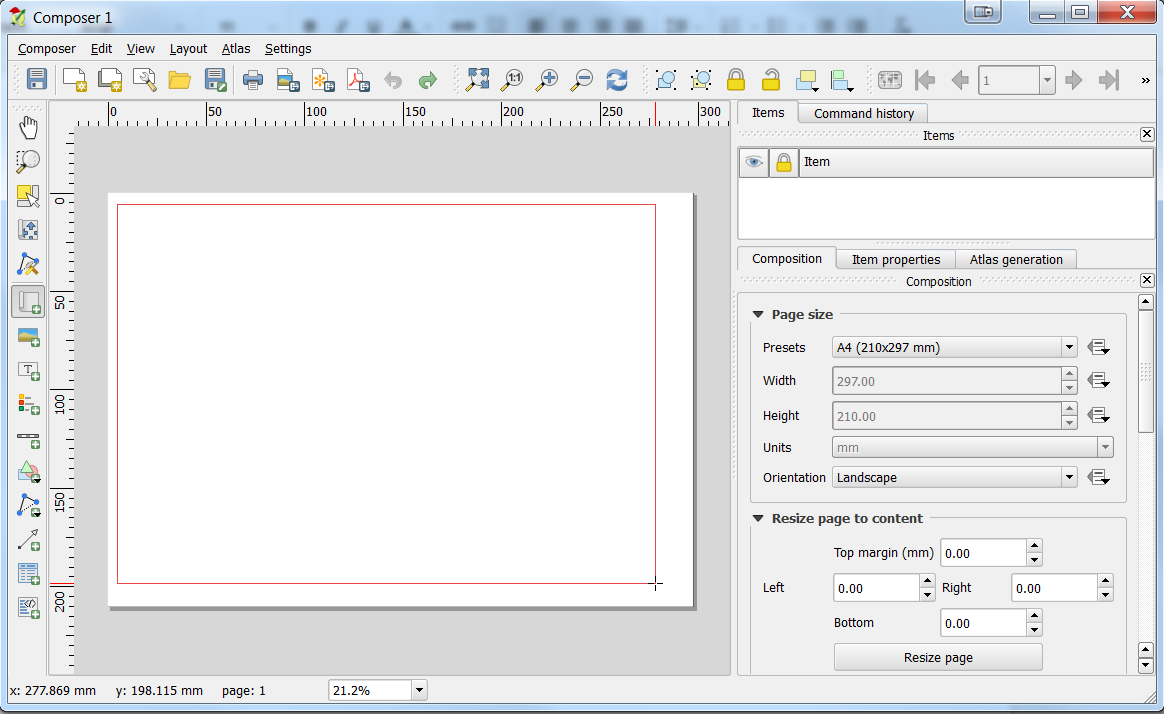
Draw a box to add your map:
You can also add text, shapes and other content.
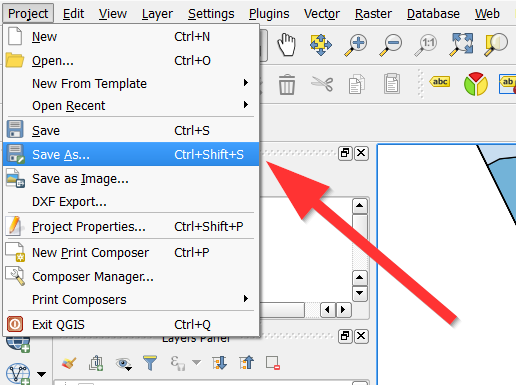
When you are done using QGIS, you can save your project as a QGIS file: