Data on the Los Angeles Open Data Portal
Getting Started
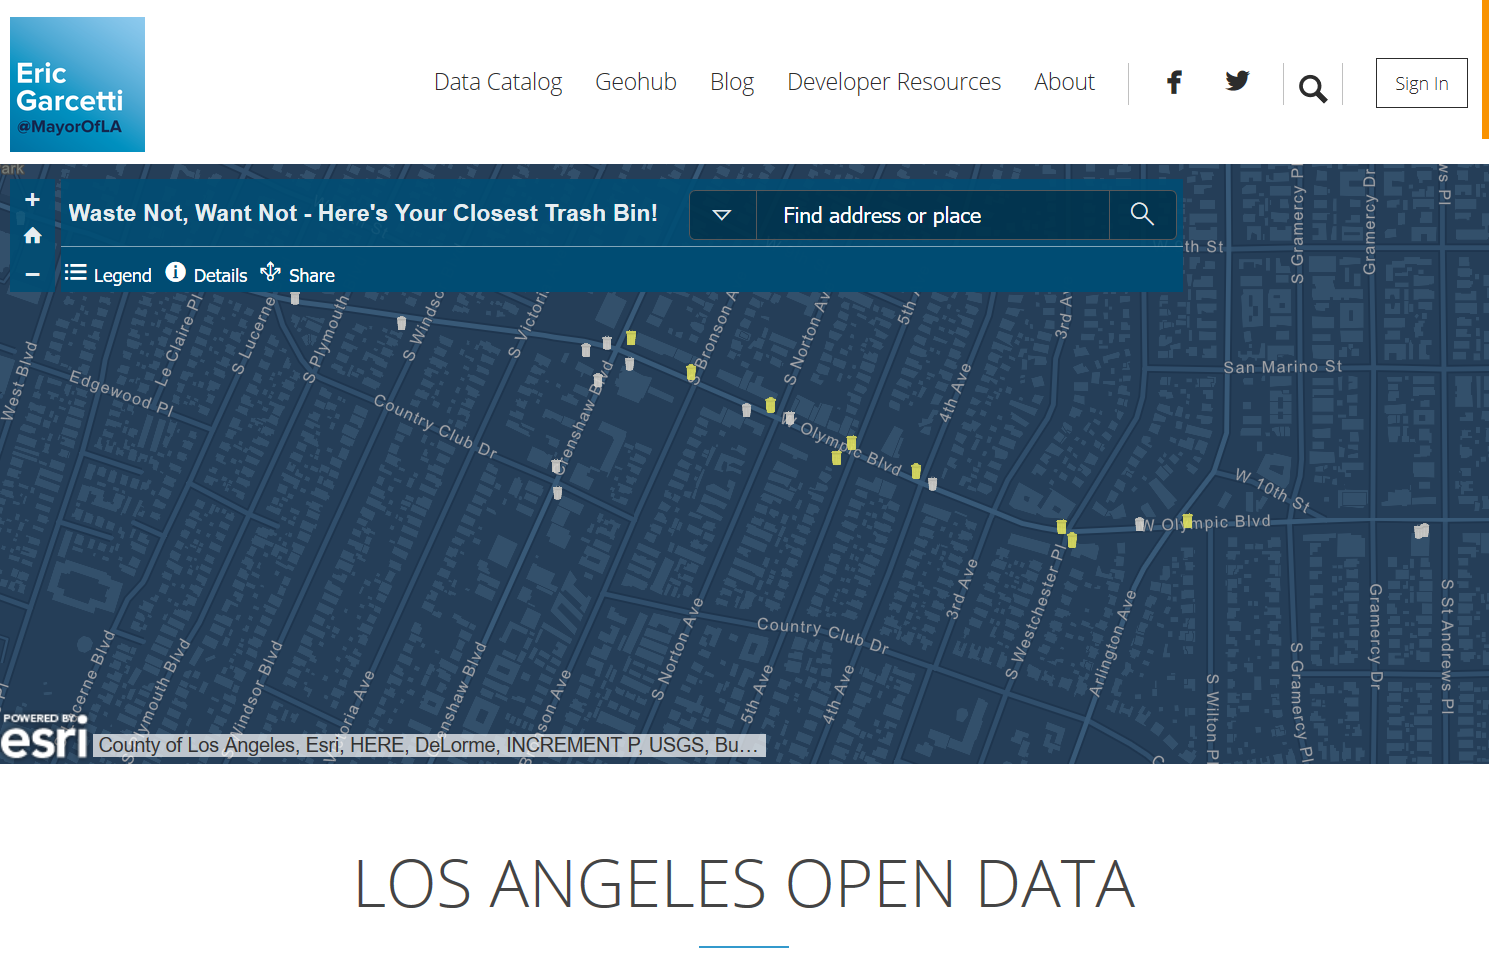
- Navigate to the LA Open Data Portal (https://data.lacity.org/)
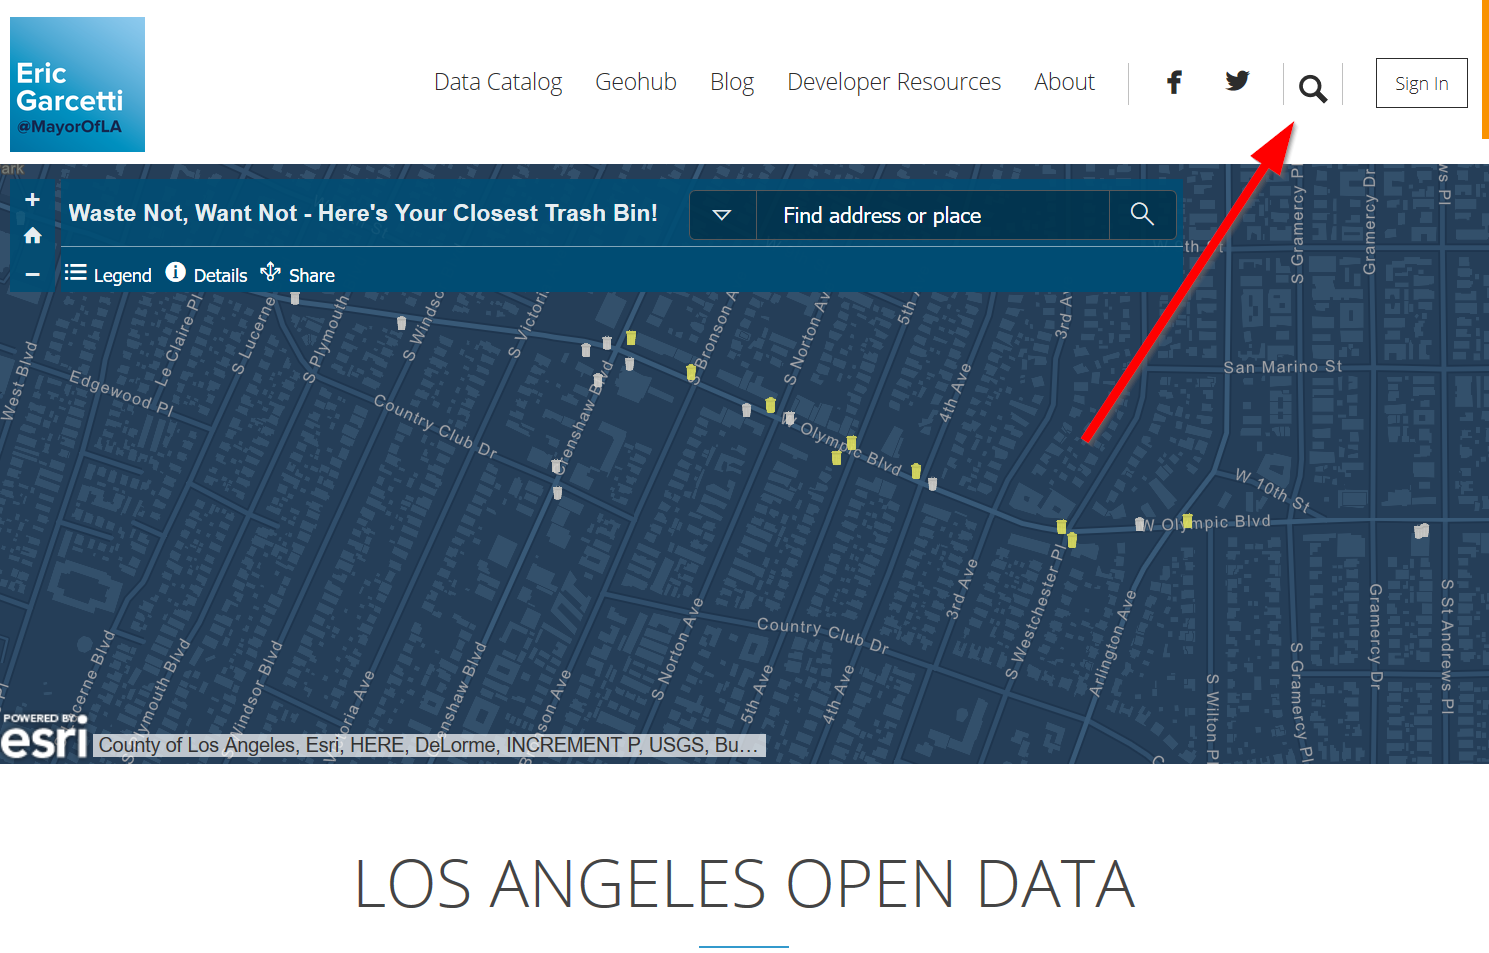
3. Click the magnifying glass:
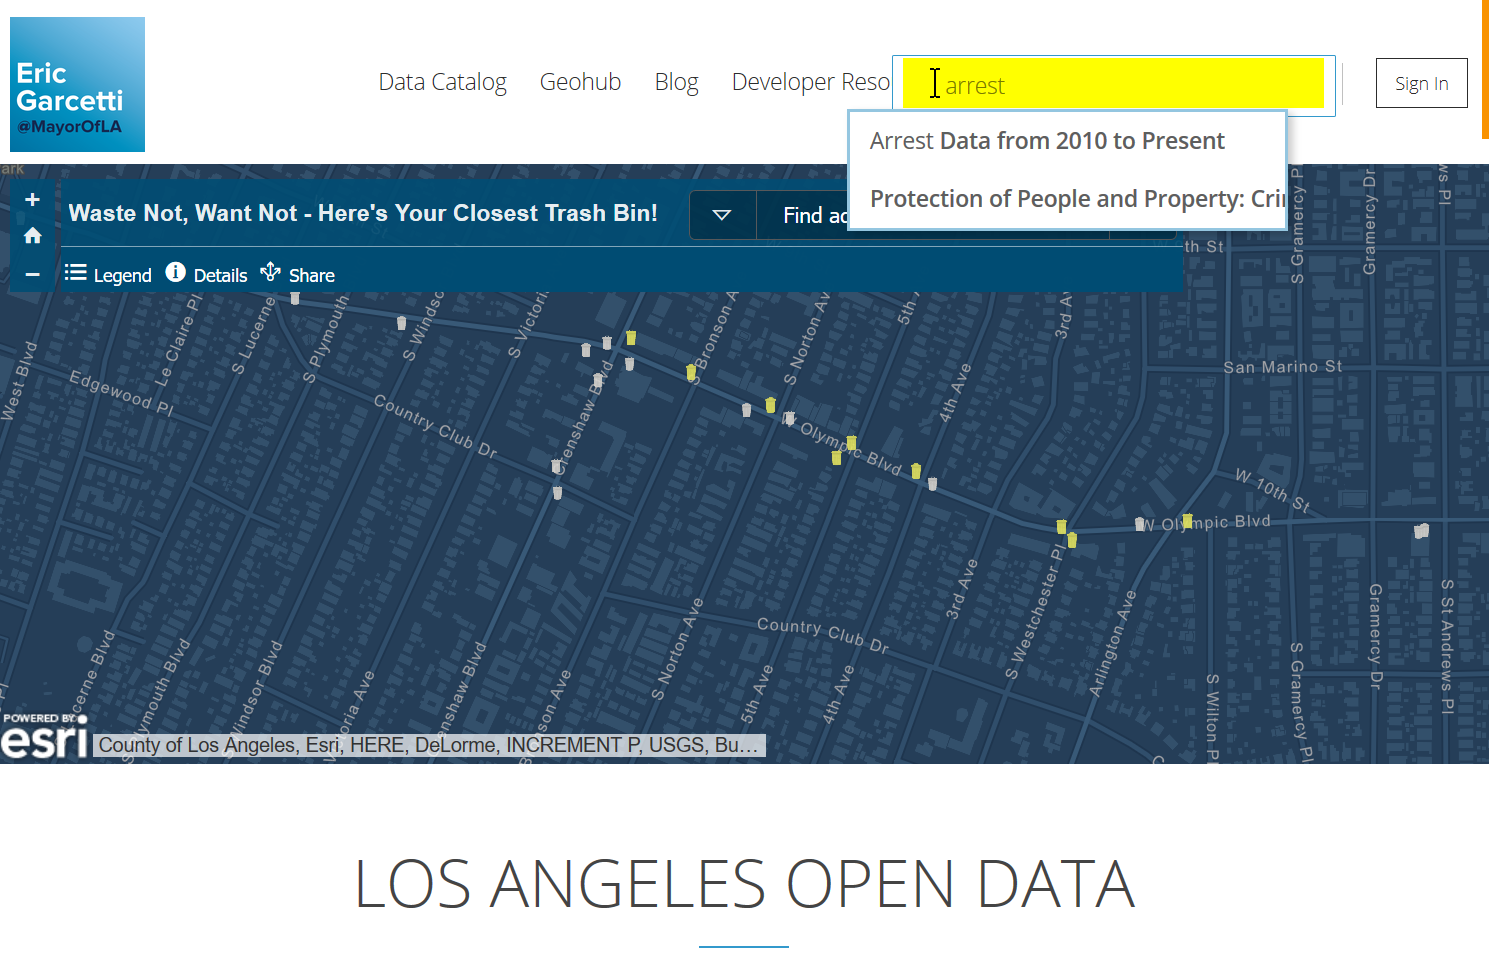
4. Find the “arrest data set” by typing “arrest” in the search tool
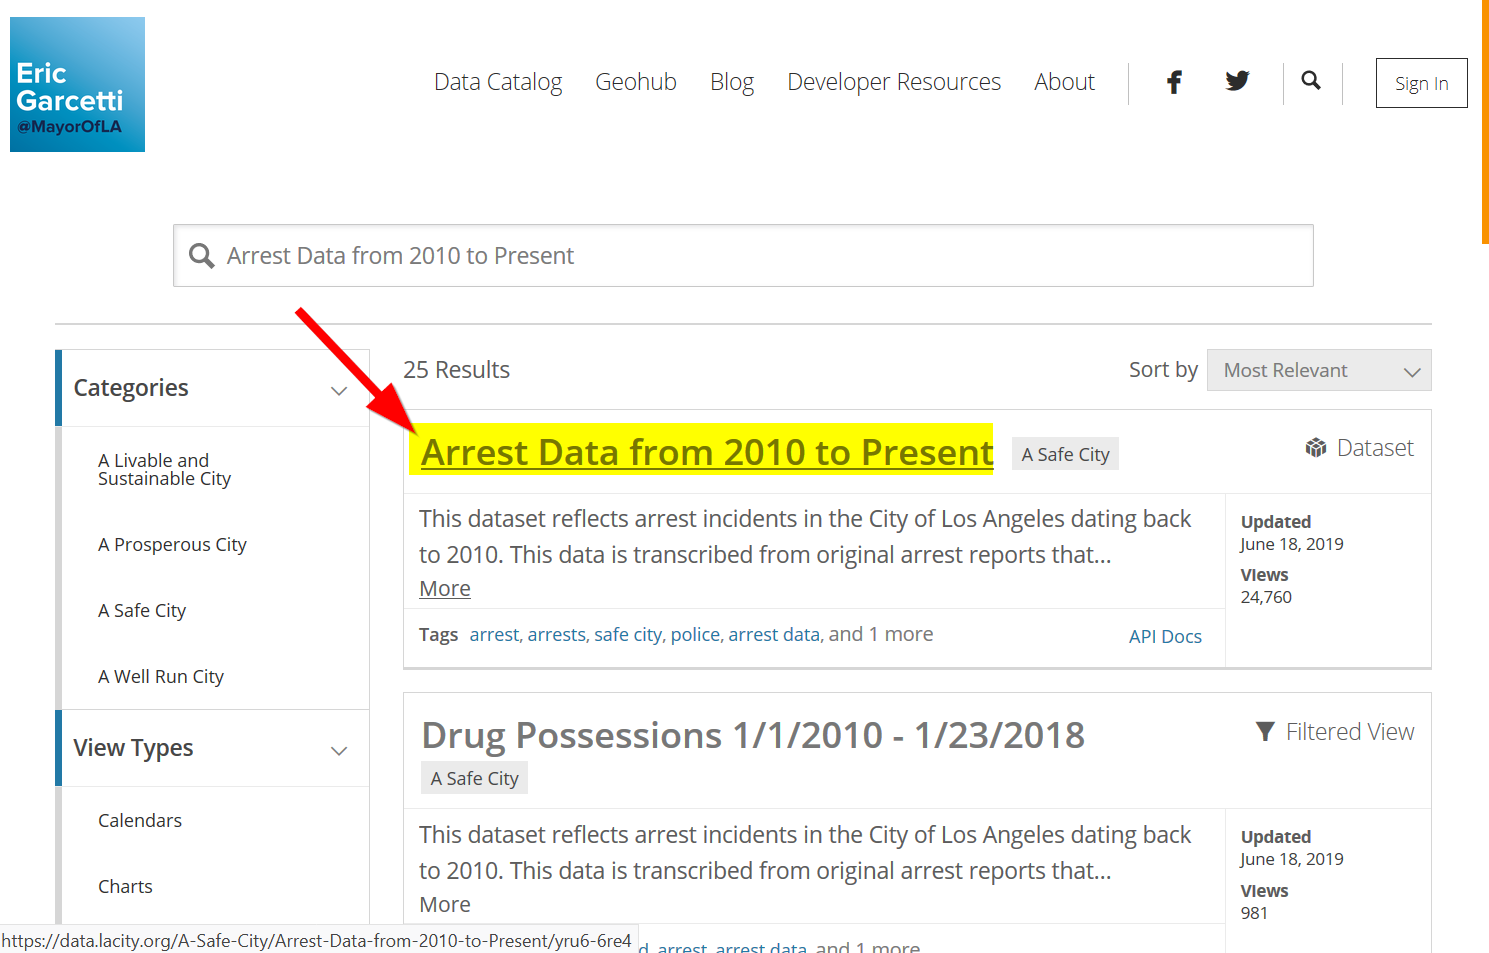
5. In the results page, click on “Arrest Data from 2010 to Present”
Viewing Data
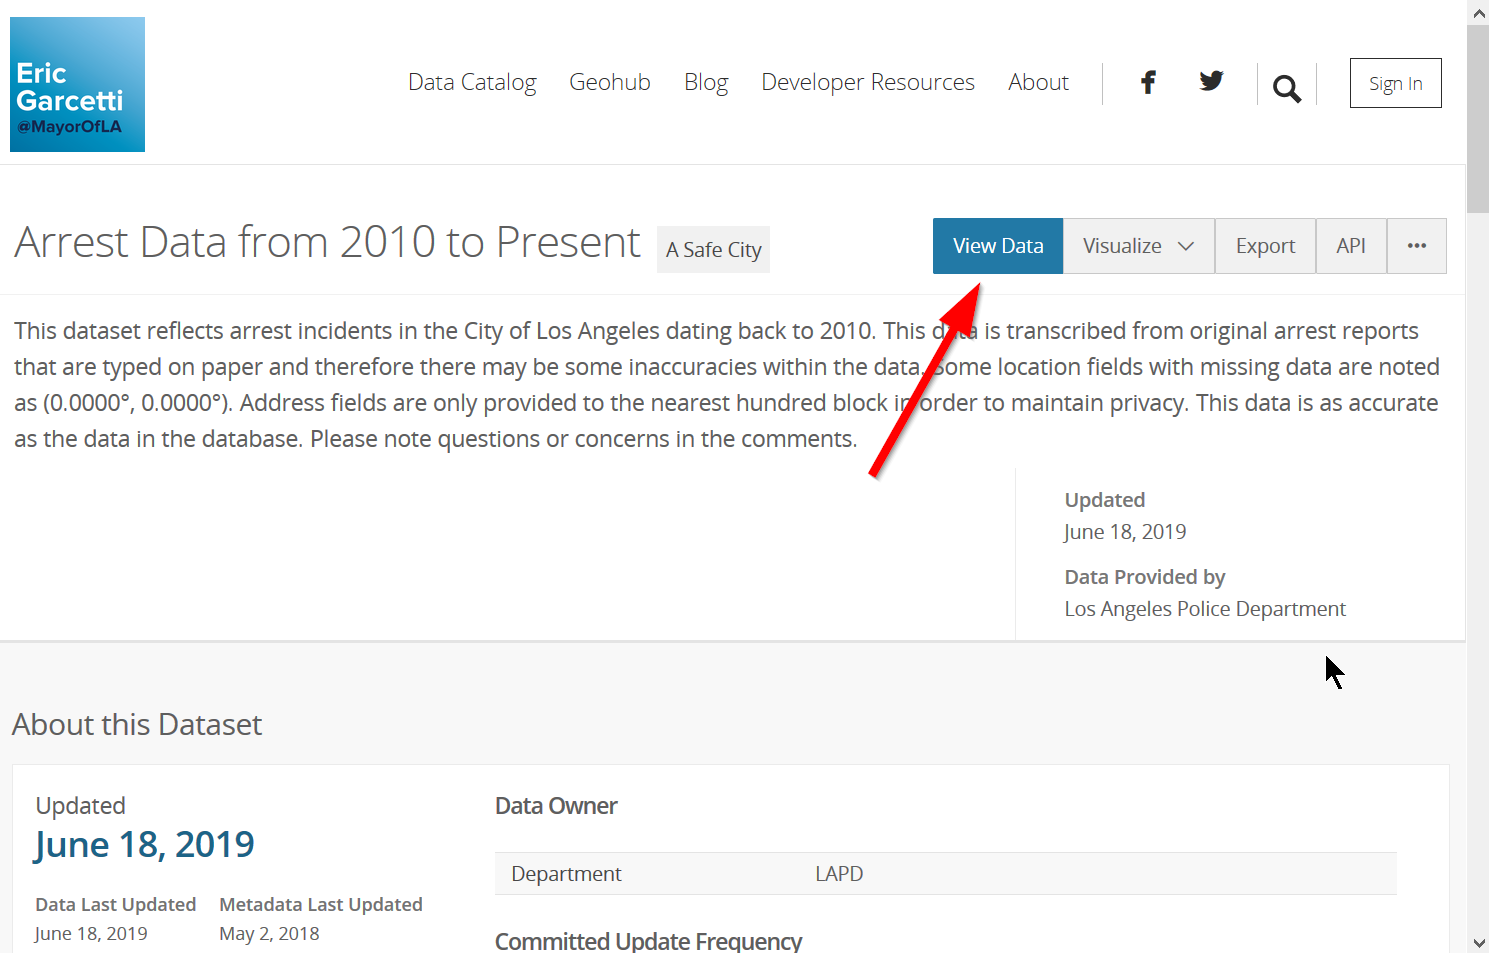
- In the Data set page, you can view information about the data, such as column names, source of the data, etc.
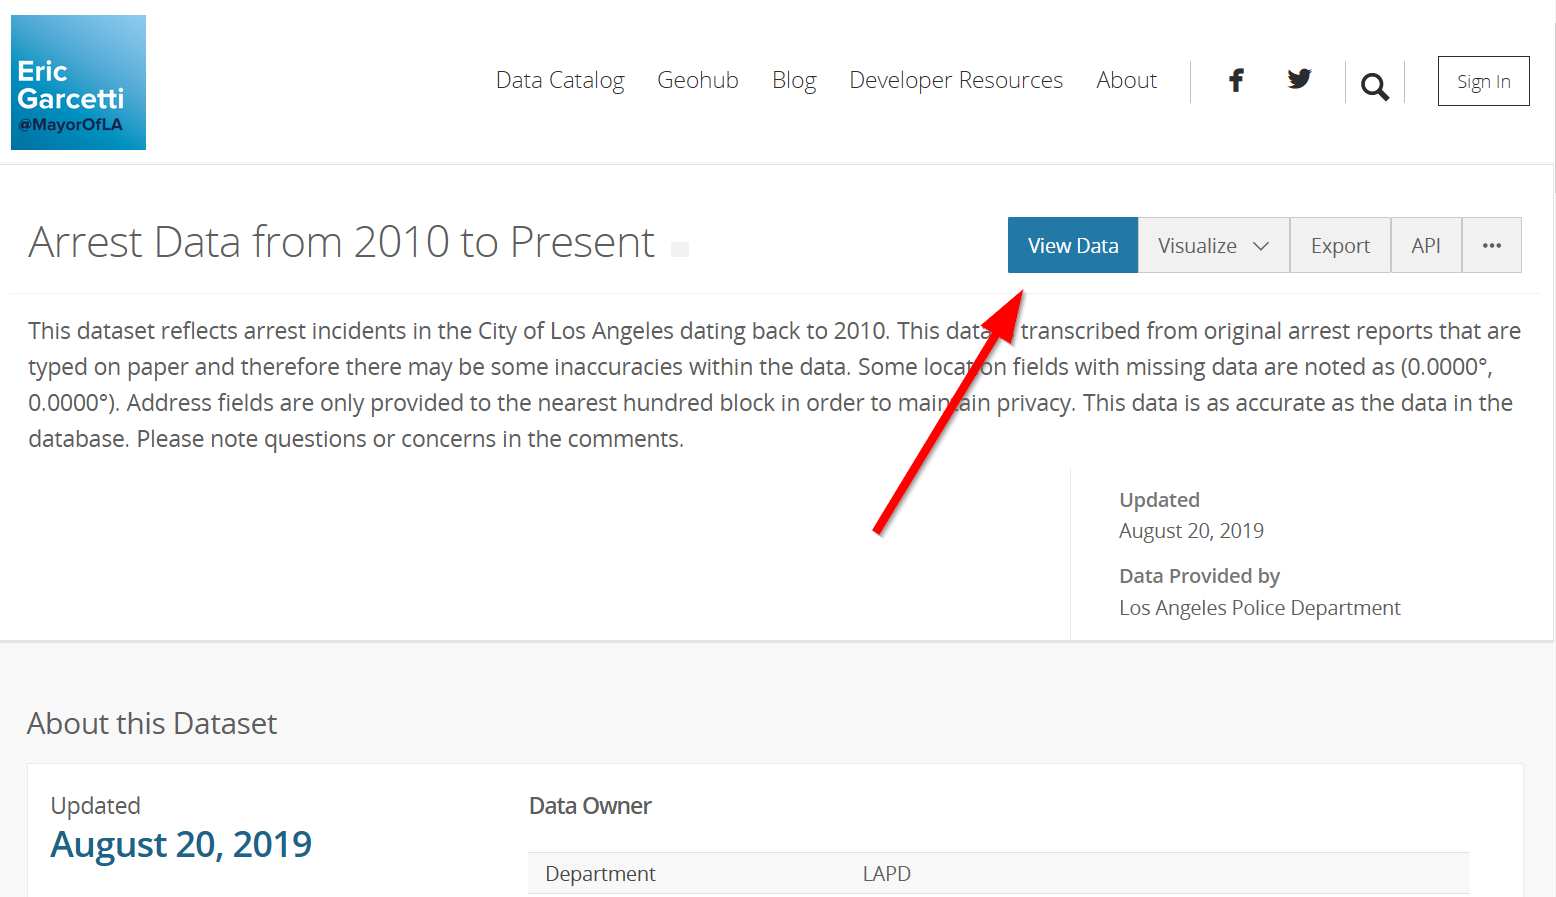
7. After familiarizing yourself with the data set, click on “View Data”
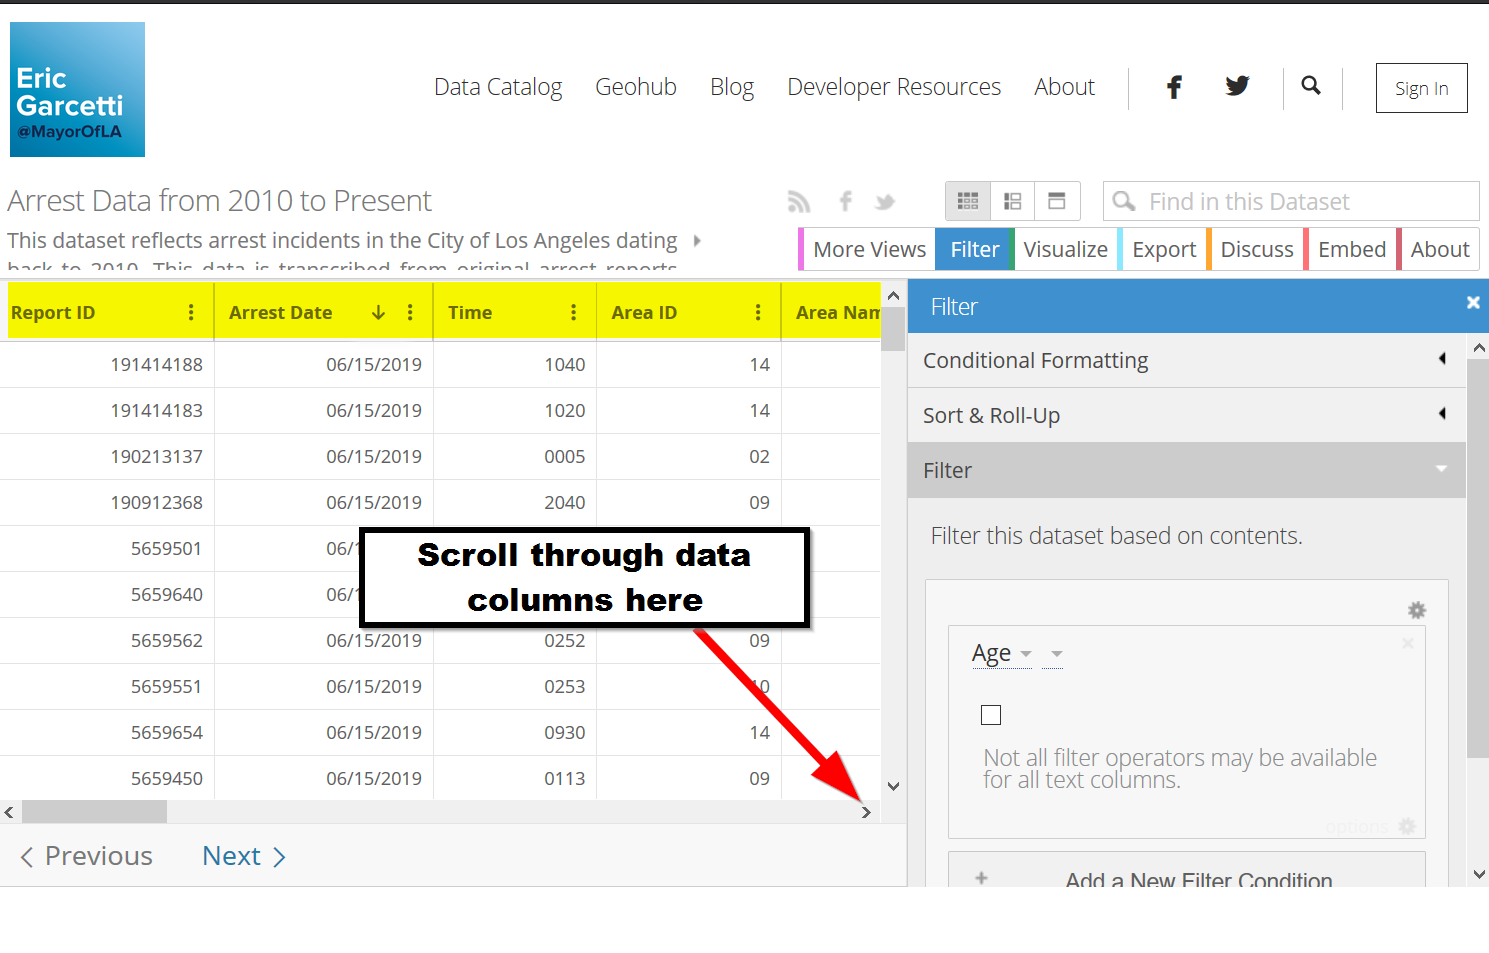
8. You can scroll through the data columns or records
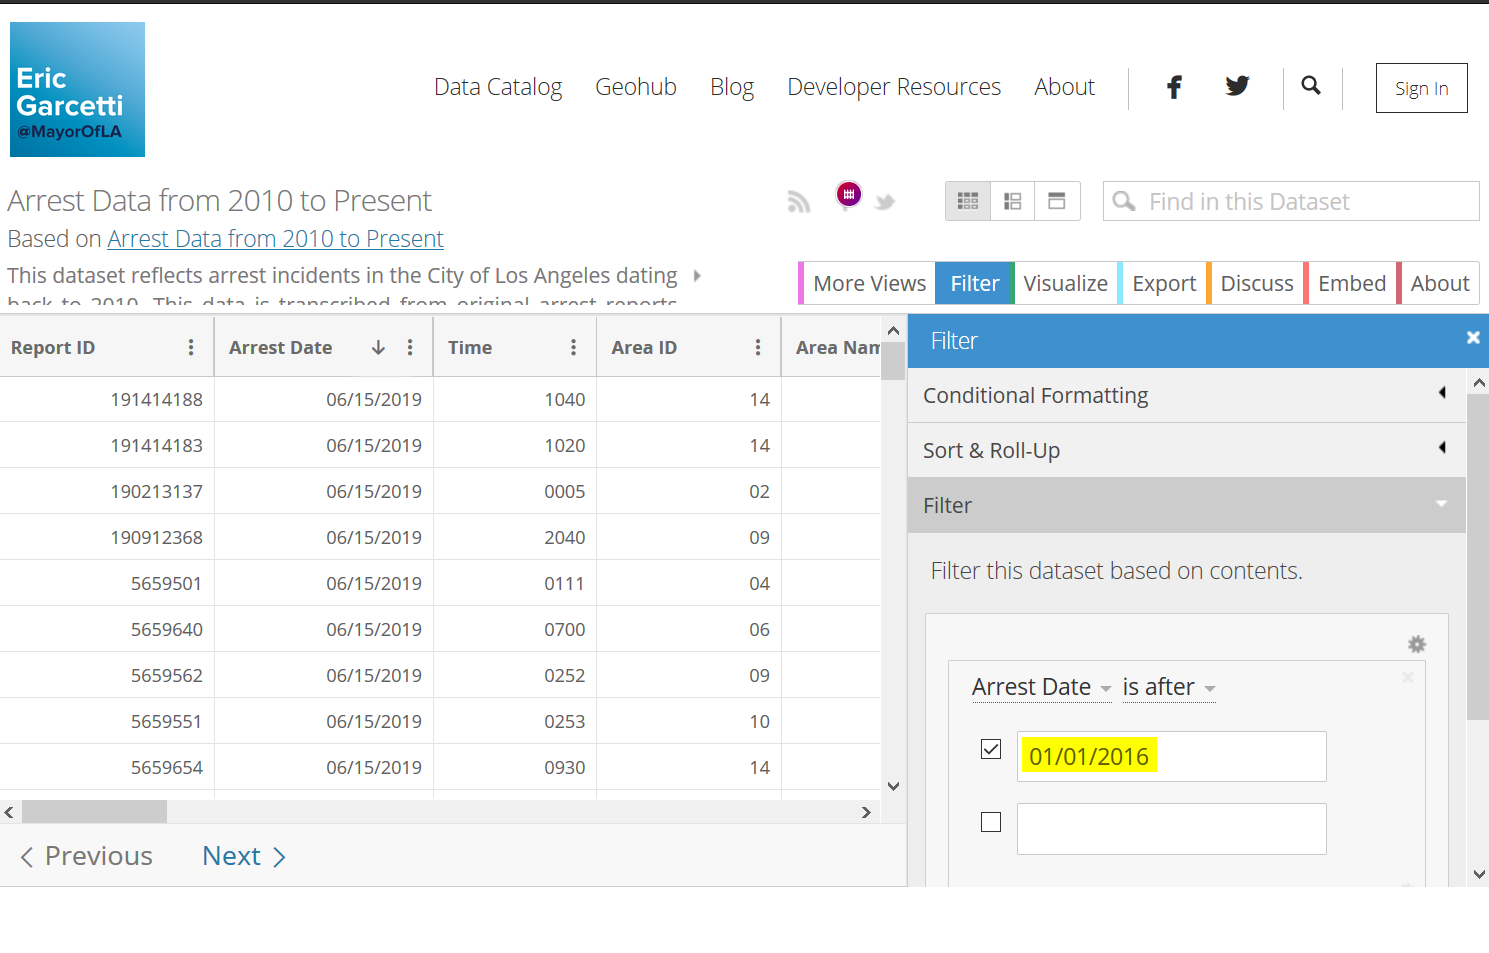
Filtering the data set by date
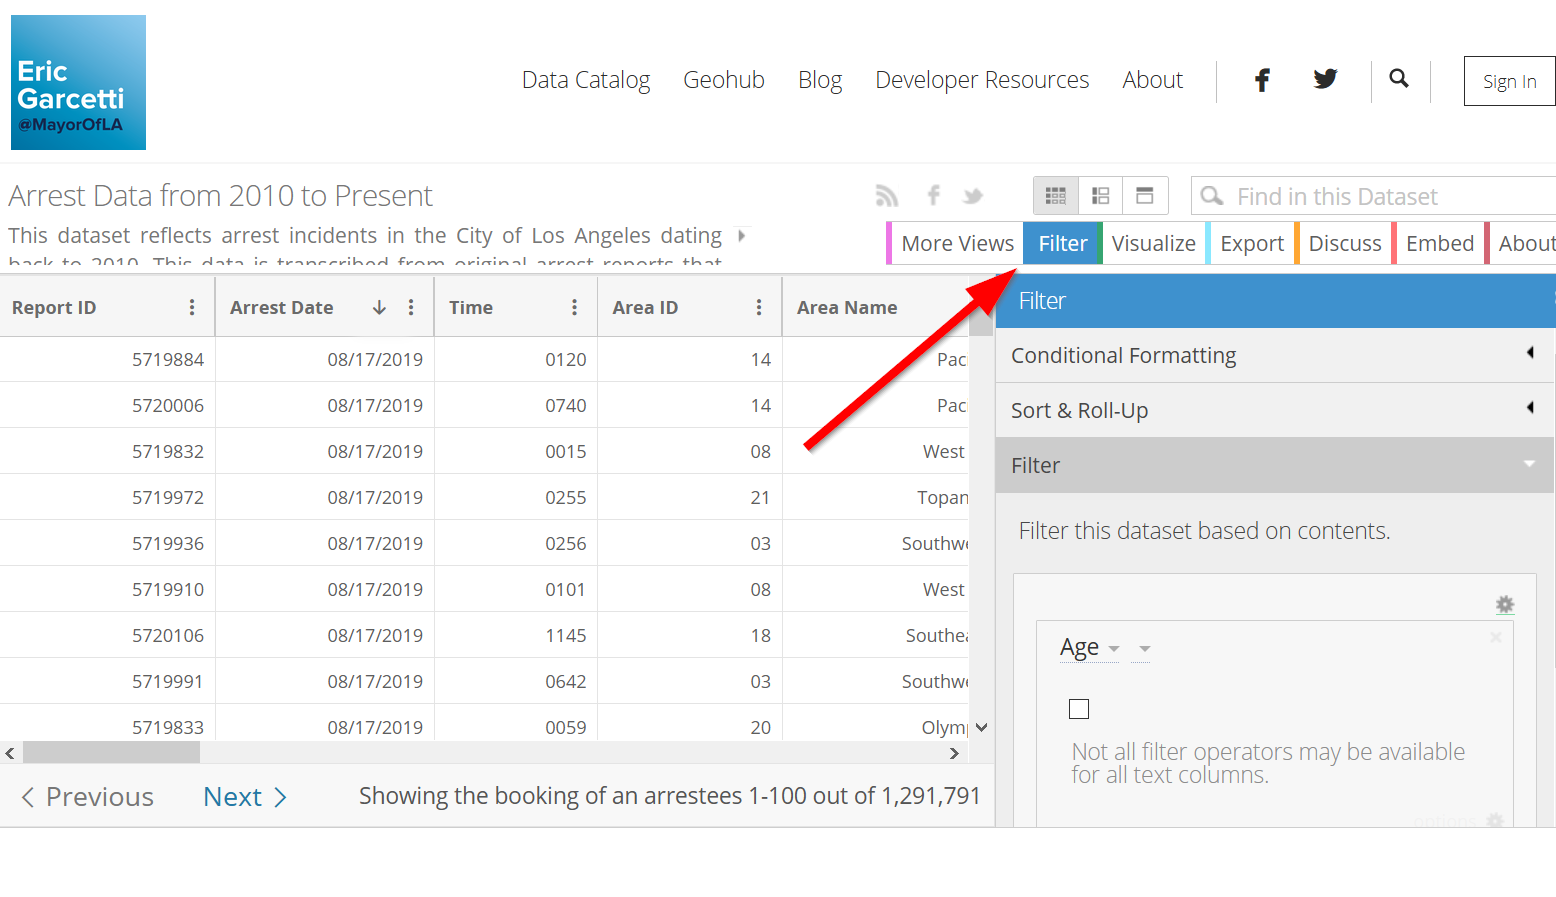
- Under “Filter” click the initial filter column
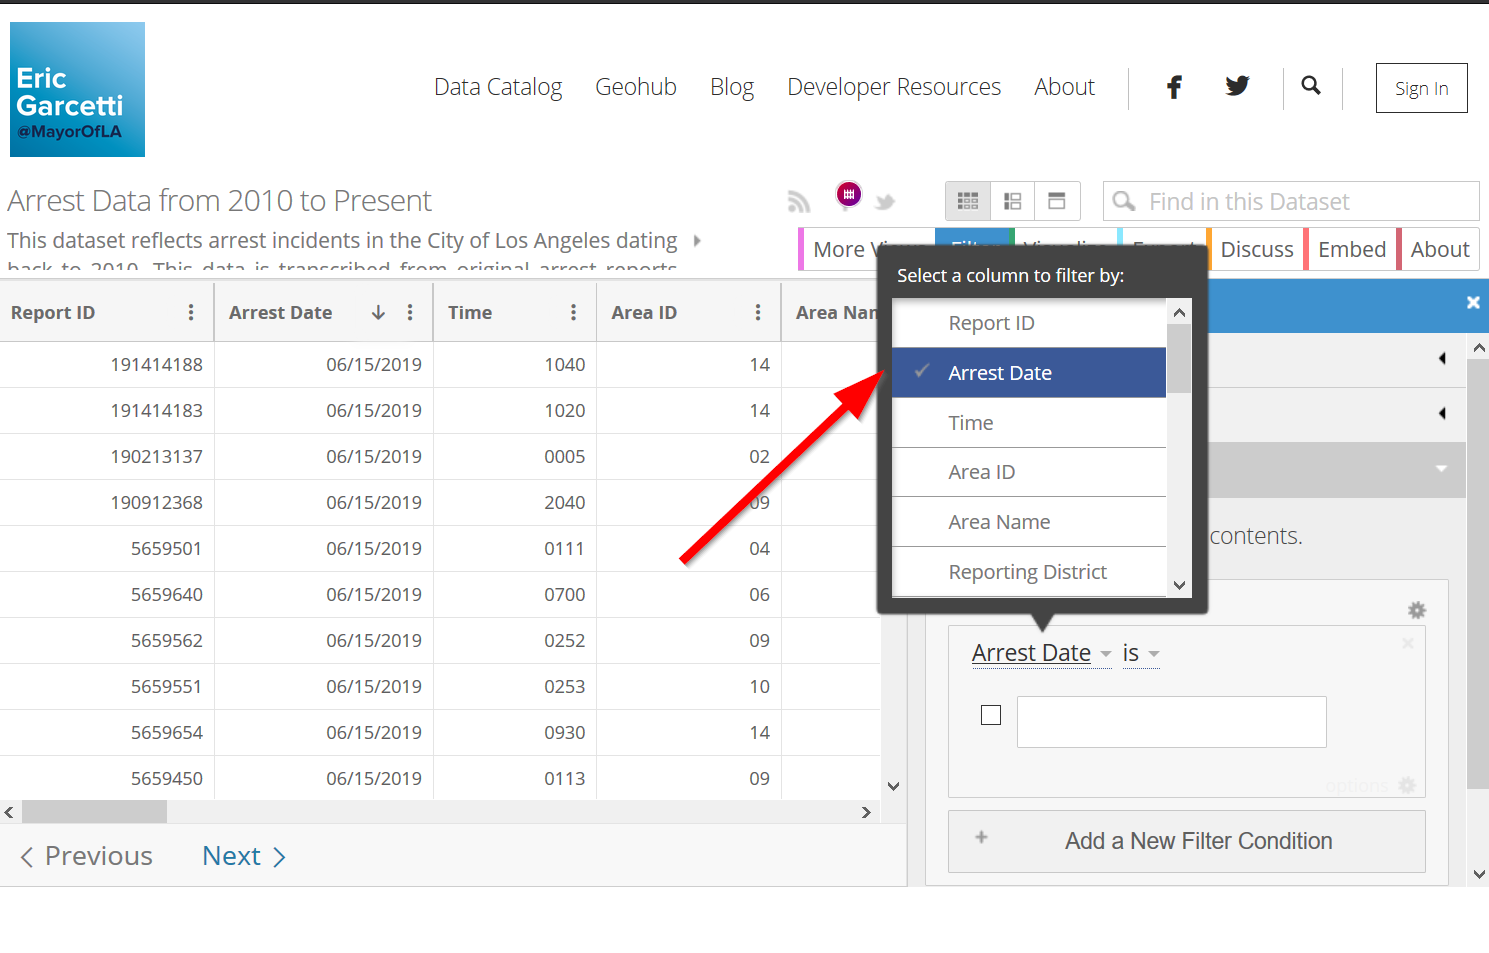
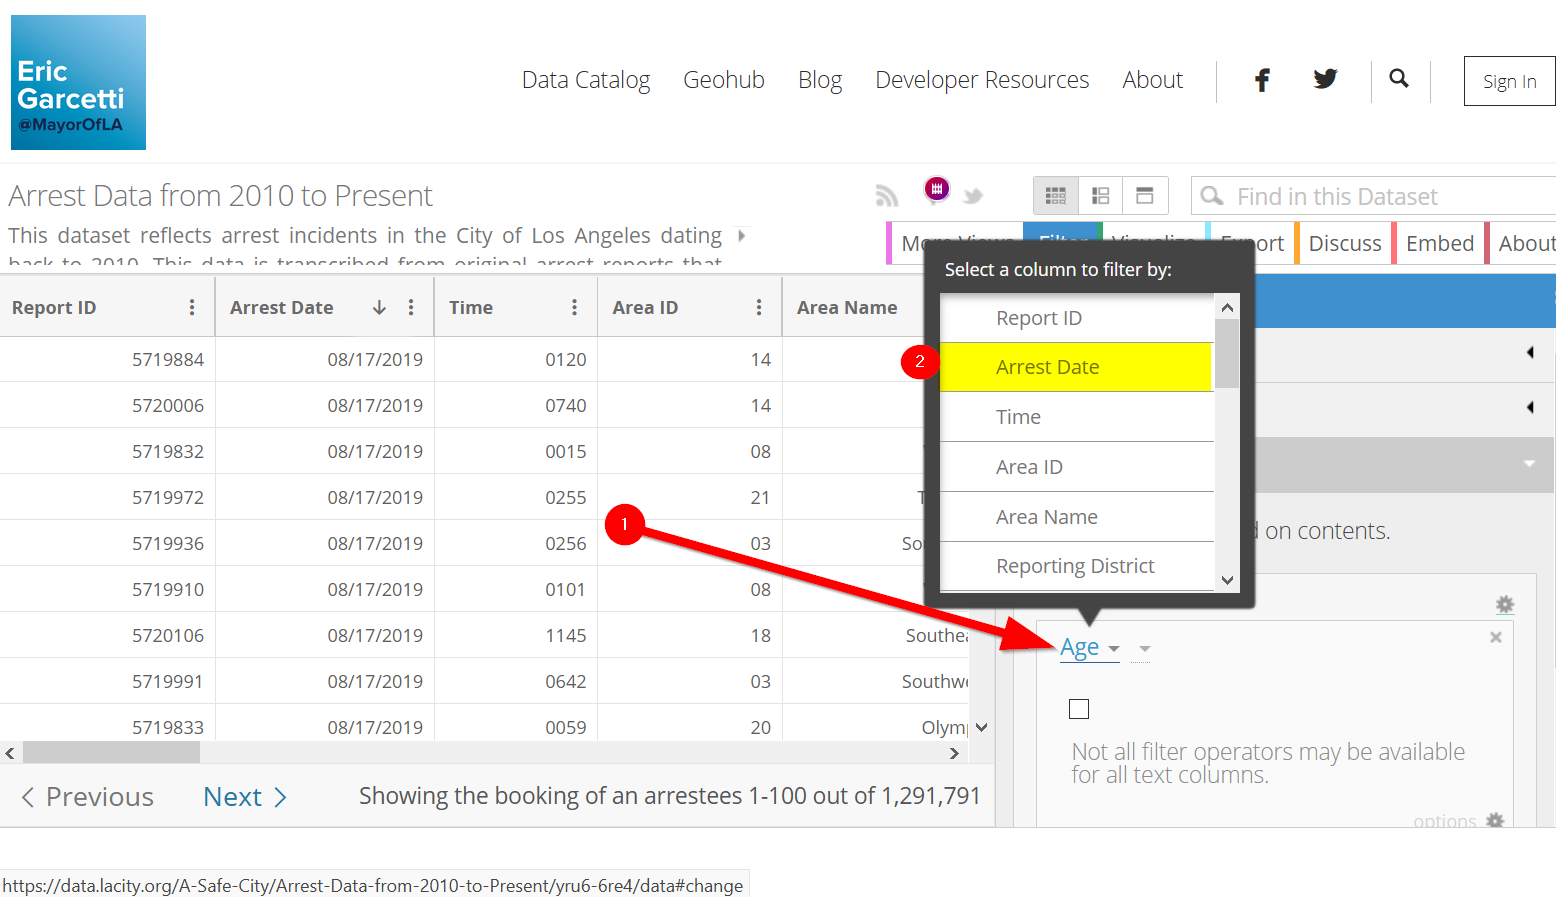
10. Choose “Arrest Date” as the column to filter by
- Next click on “is” and change the filter condition to “is after”
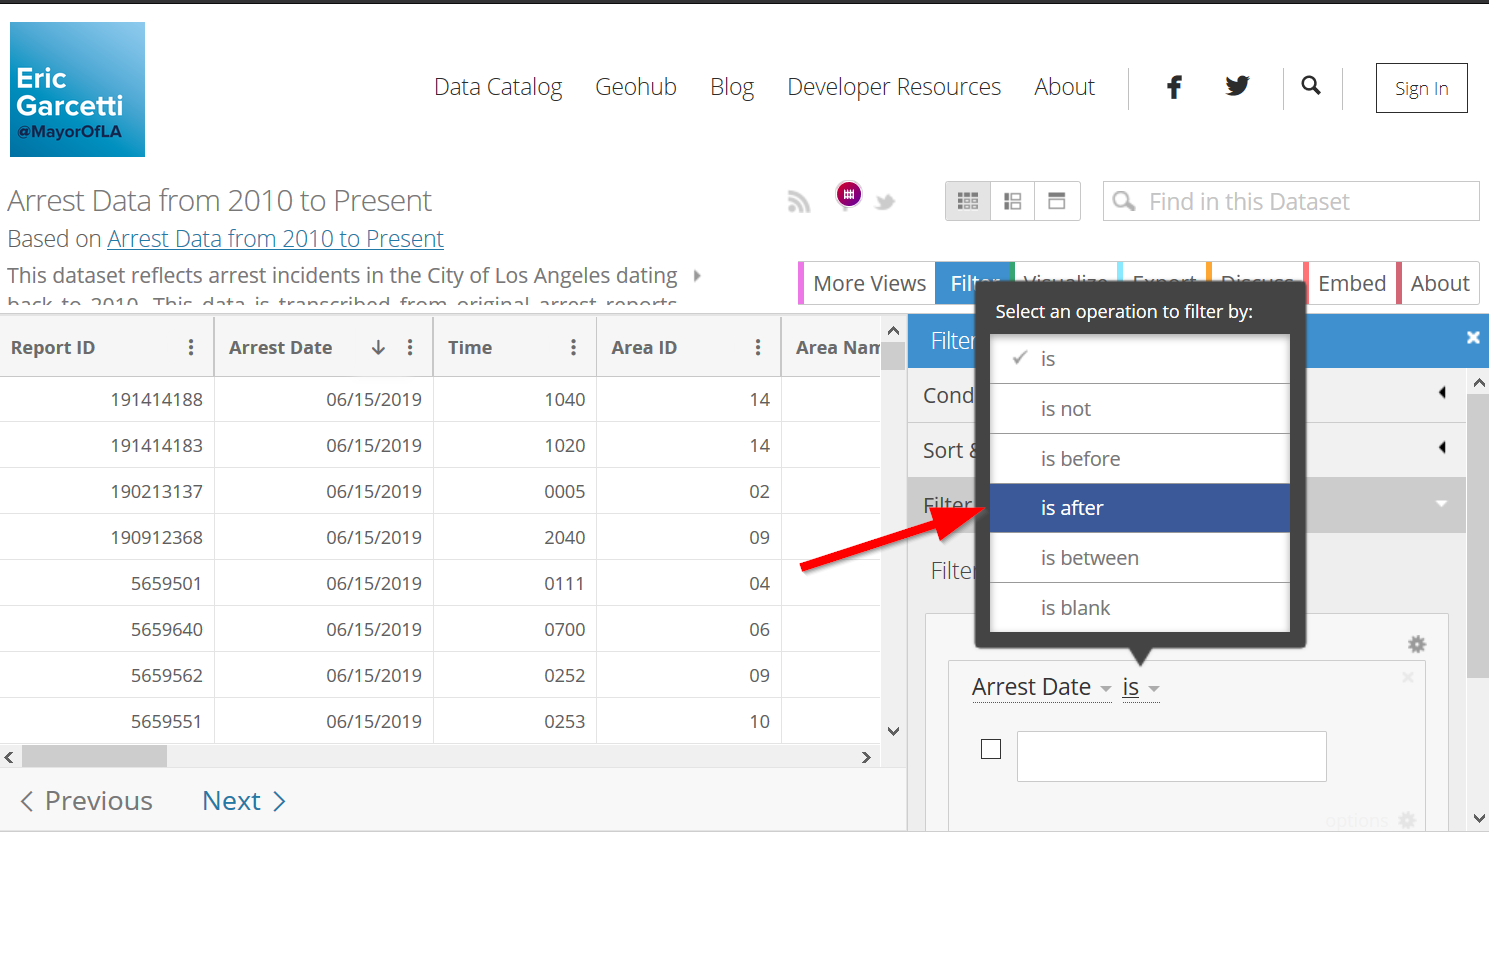
12. Choose after “2016”
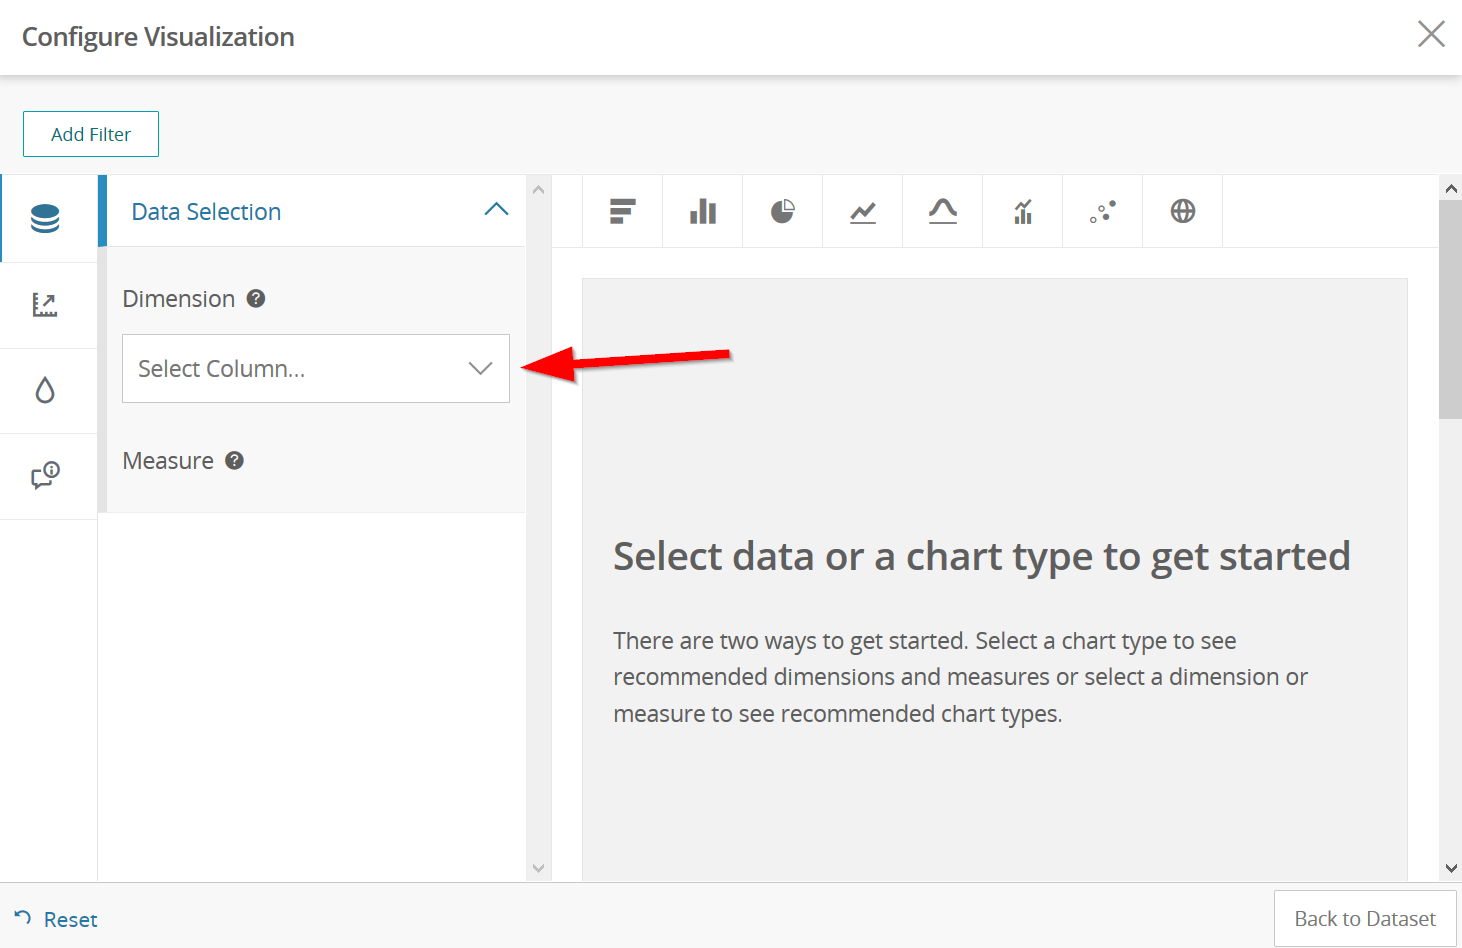
Visualizing the data
- Click on “Visualize”
14. Choose whether to “sign in” and save your visualization, or continue without being able to save. Note you can use:bigdataforjustice@gmail.com| summer2019!
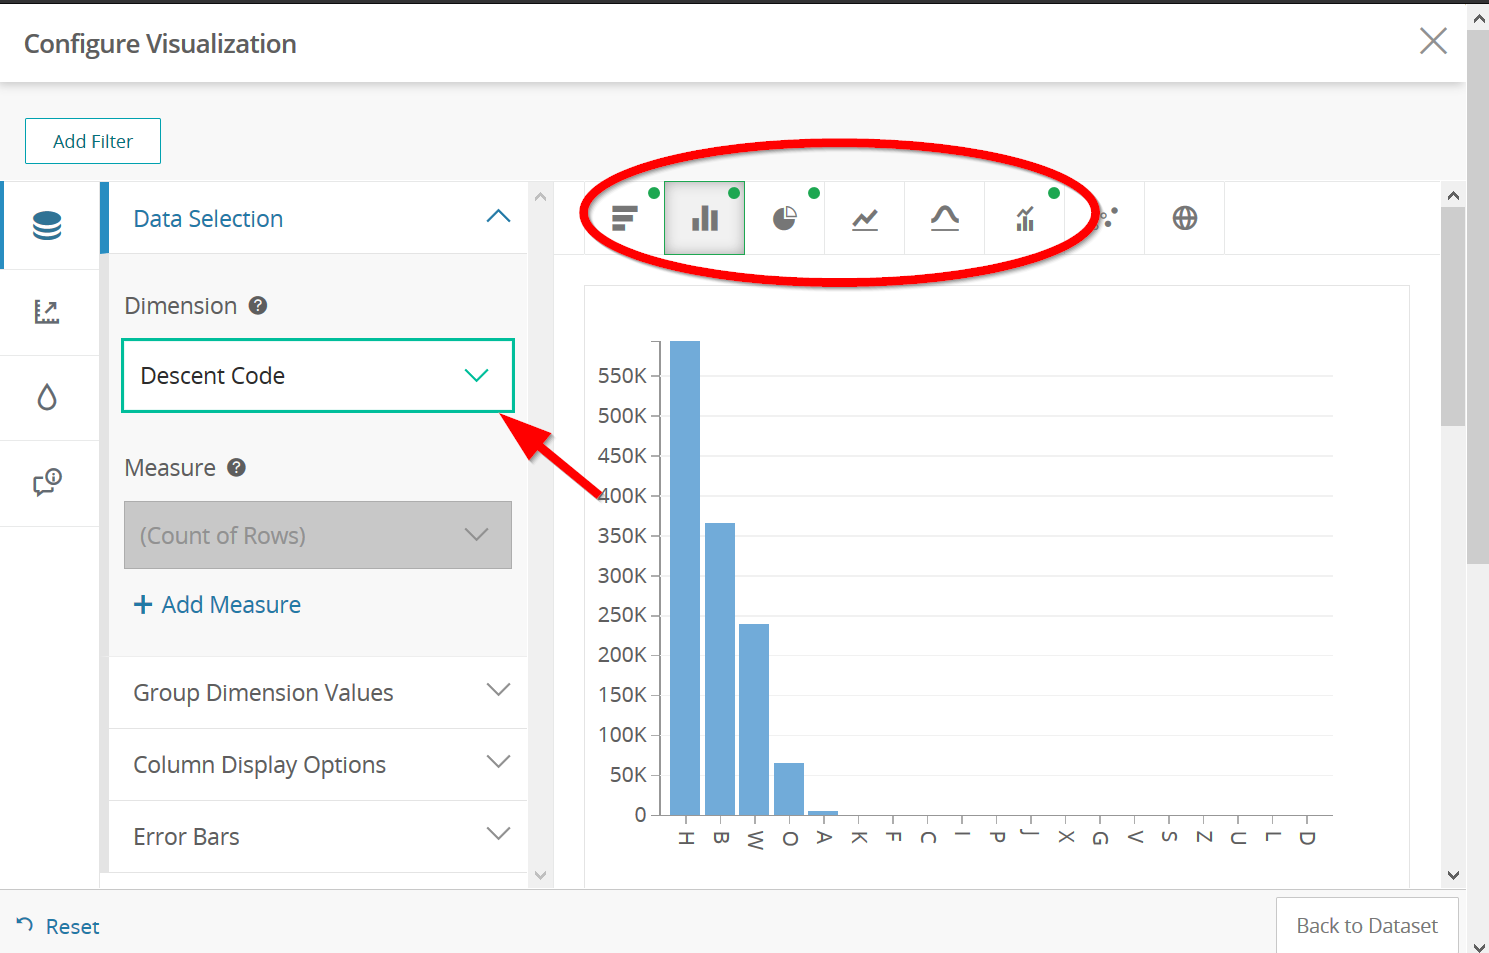
15. Click on “Select Column” to select a column to visualize.
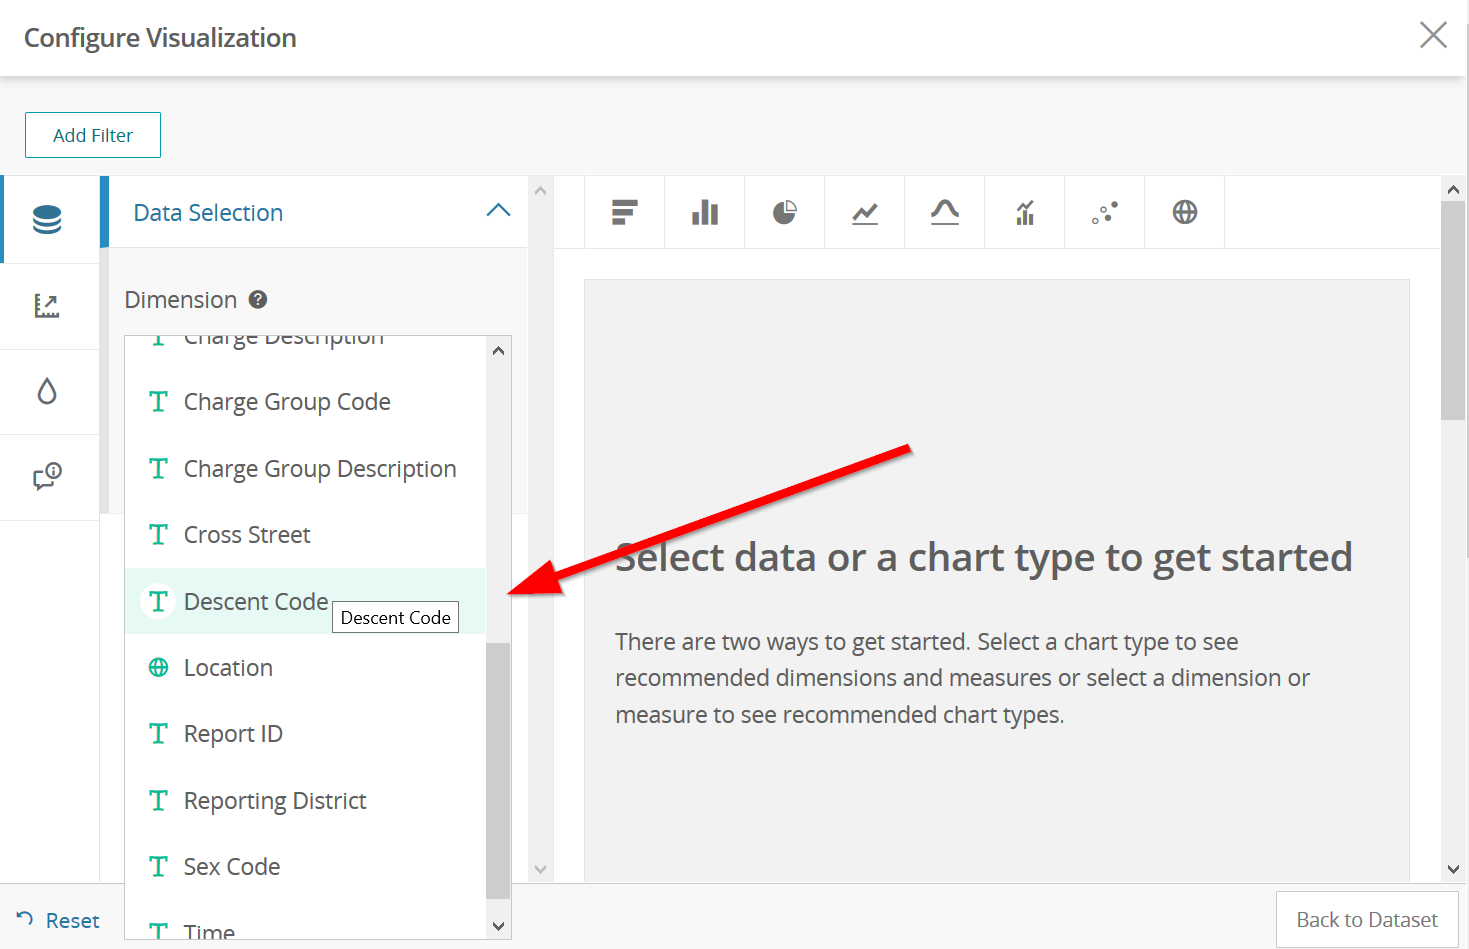
16. Select “Descent Code” to start visualizing the data.
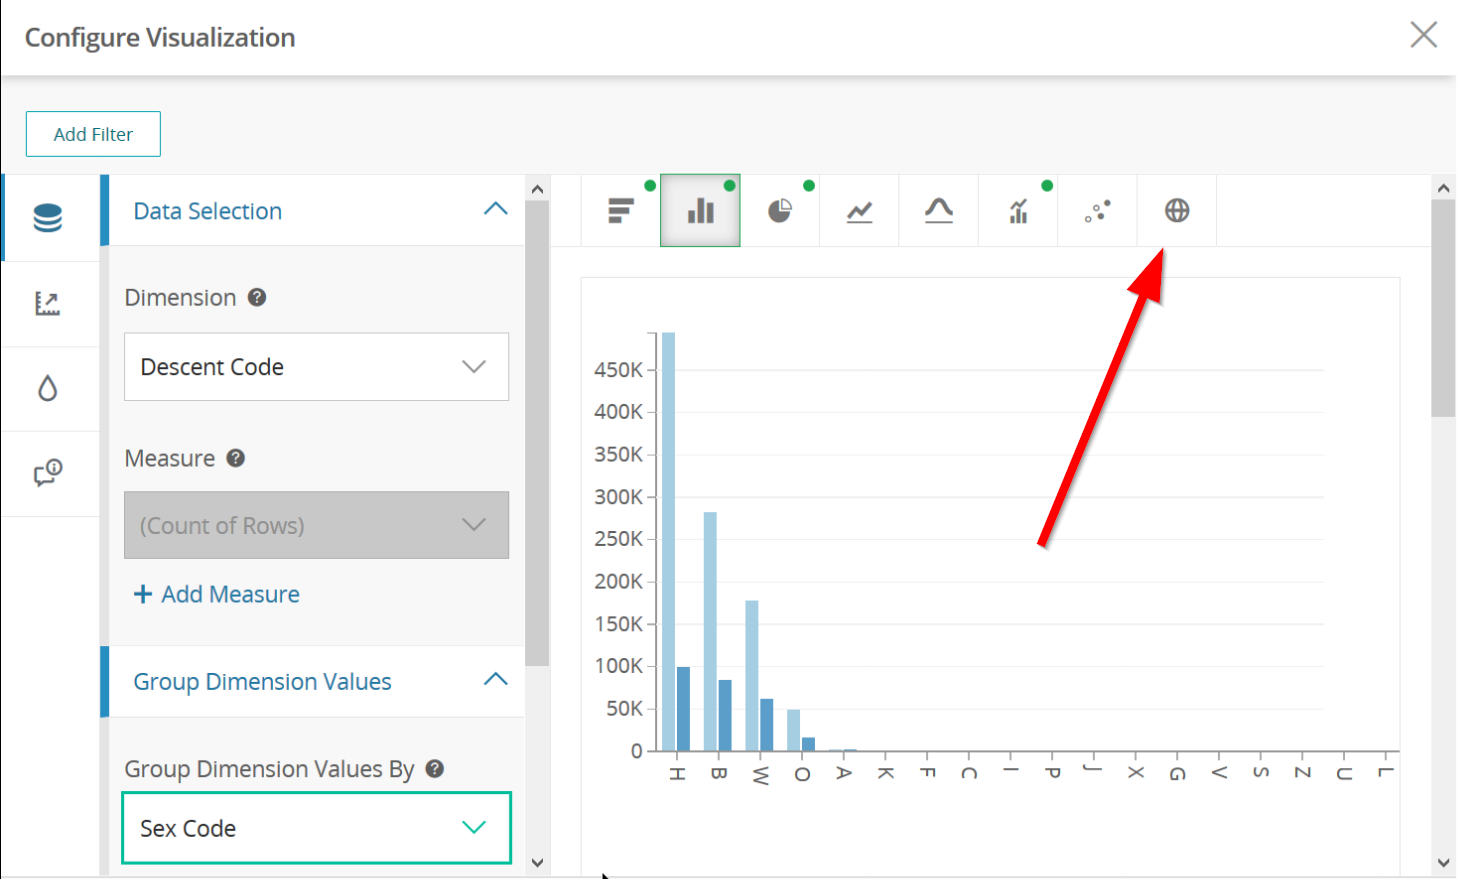
17. You can scroll down and group the data by other values, for example, “Descent Code by Sex”
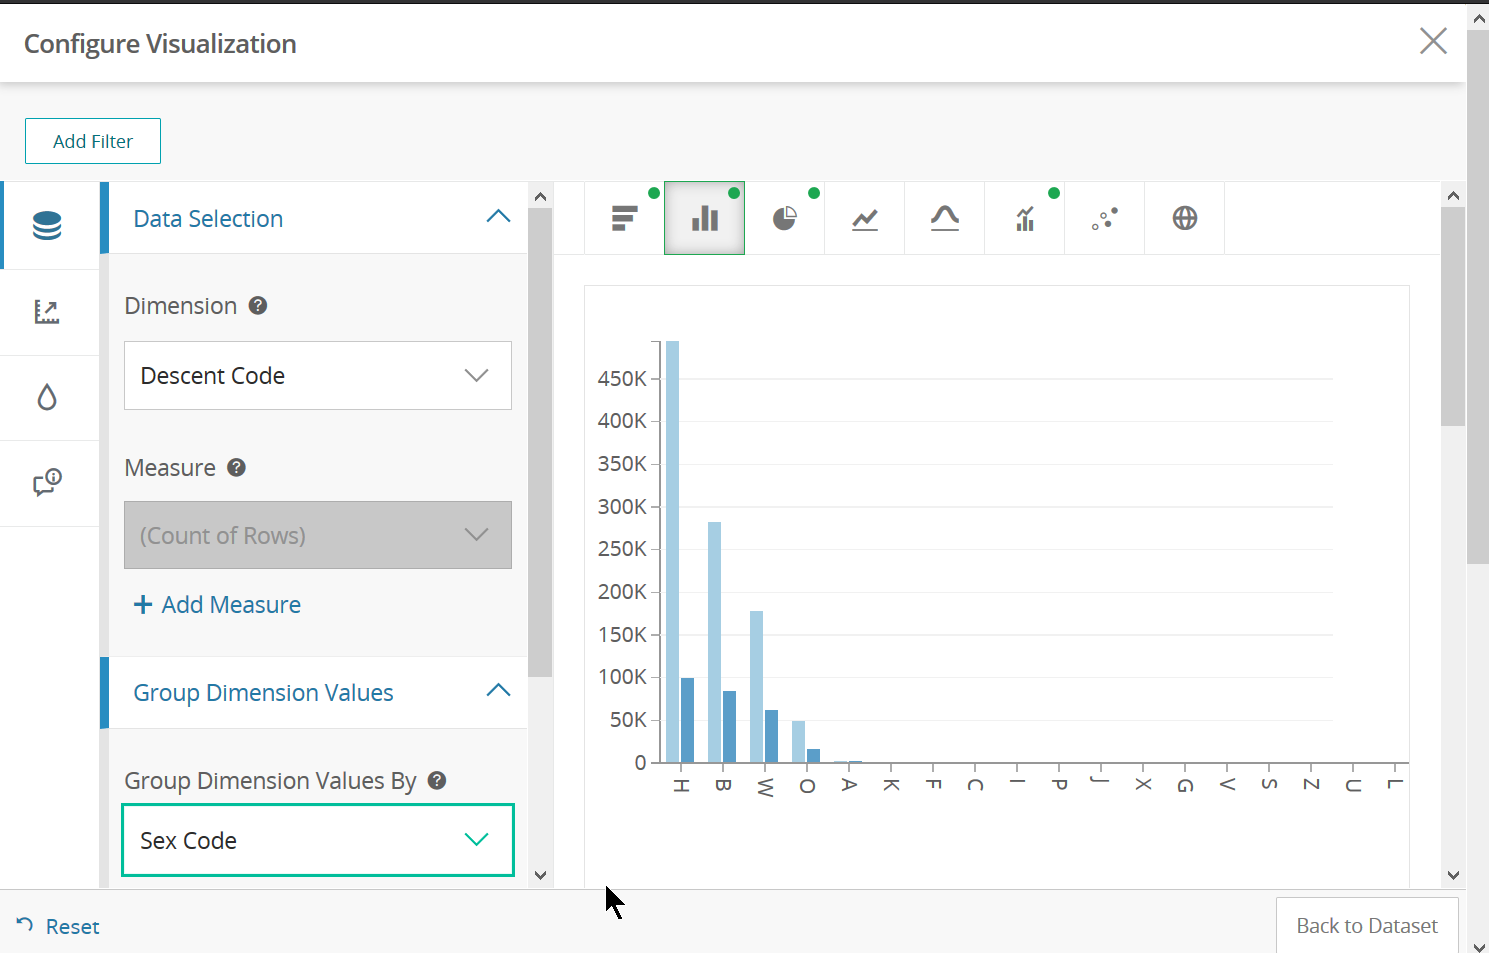
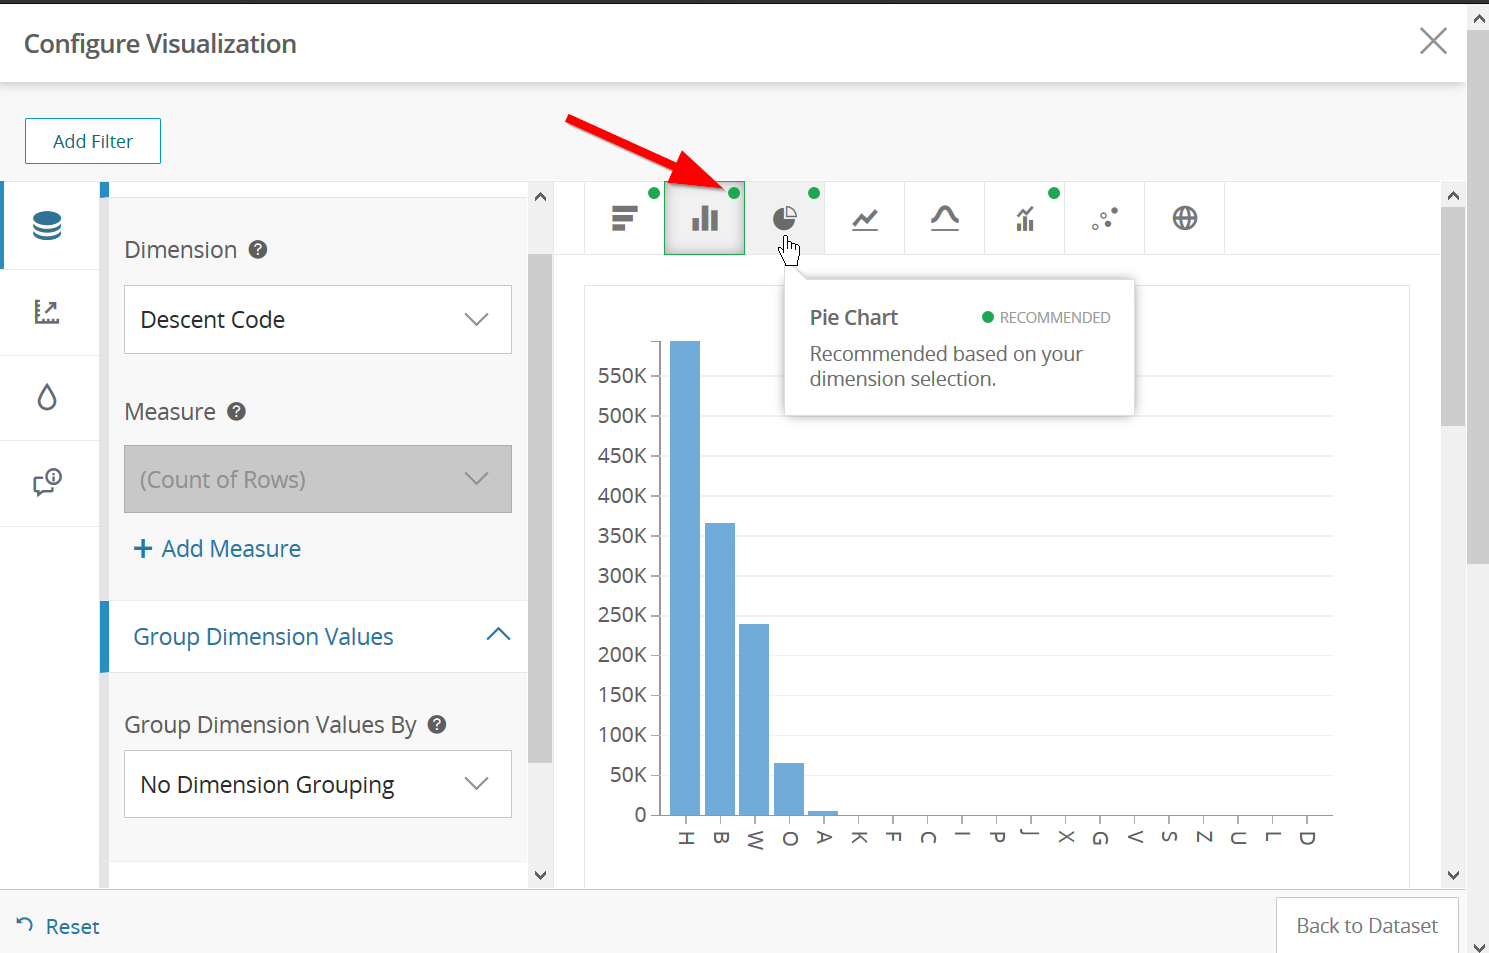
18. You can switch the visualization by clicking on one of the buttons on the right
19. The green circle shows a recommended visualization
Mapping our data
20. We will choose map, which is the globe to the right:
21. To find Los Angeles, click the search icon in the map and type in “Los Angeles”
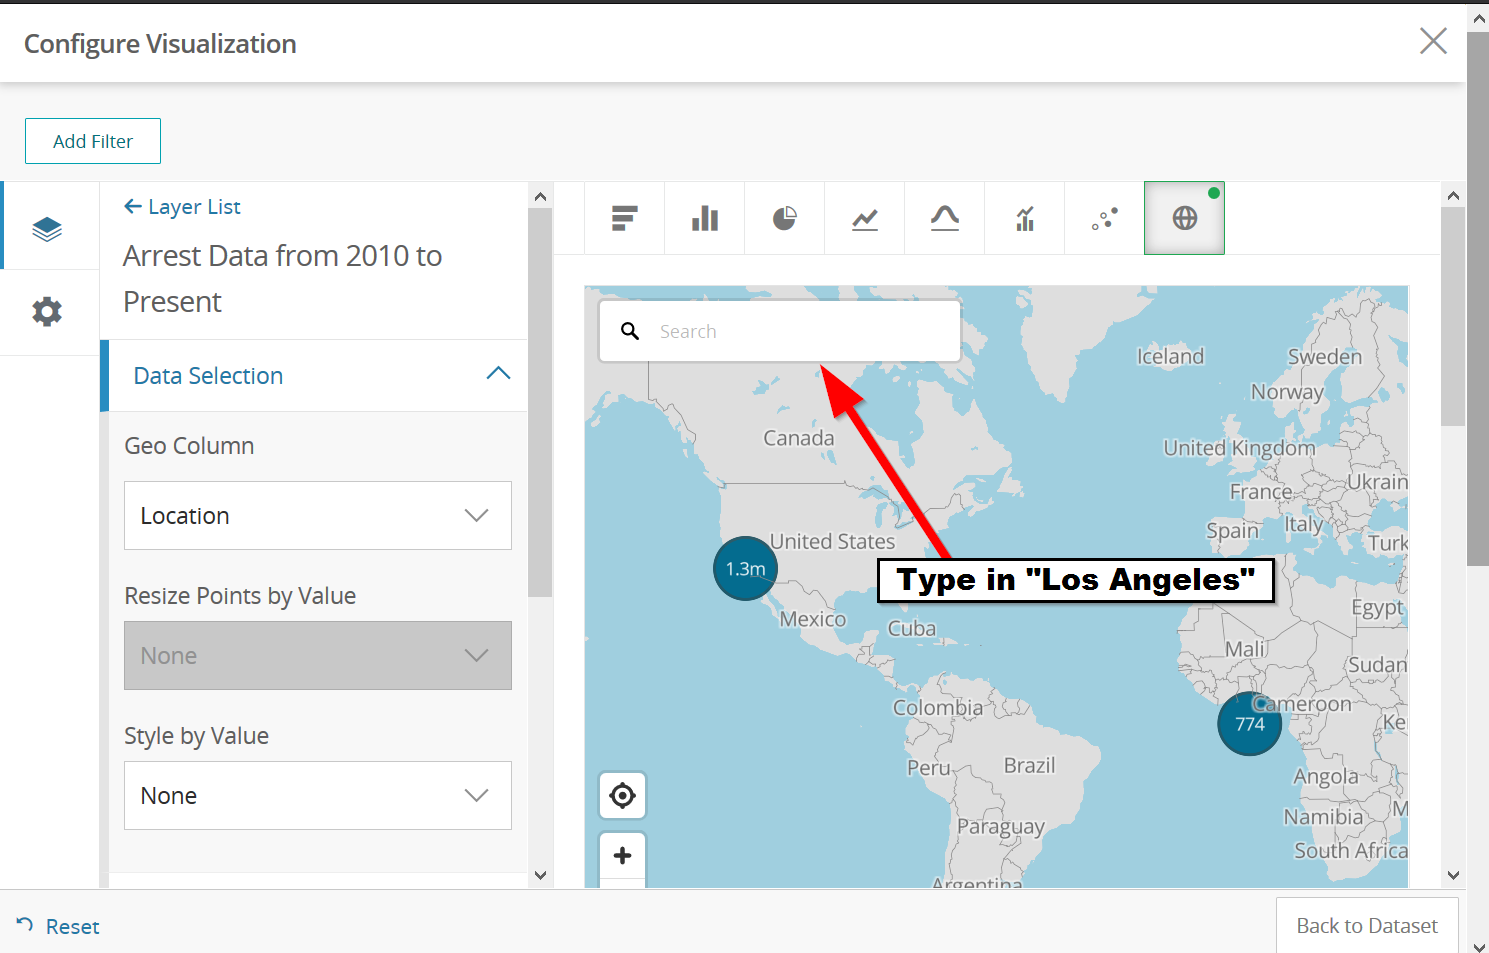
22. This is our data, but we can scroll down for more options:
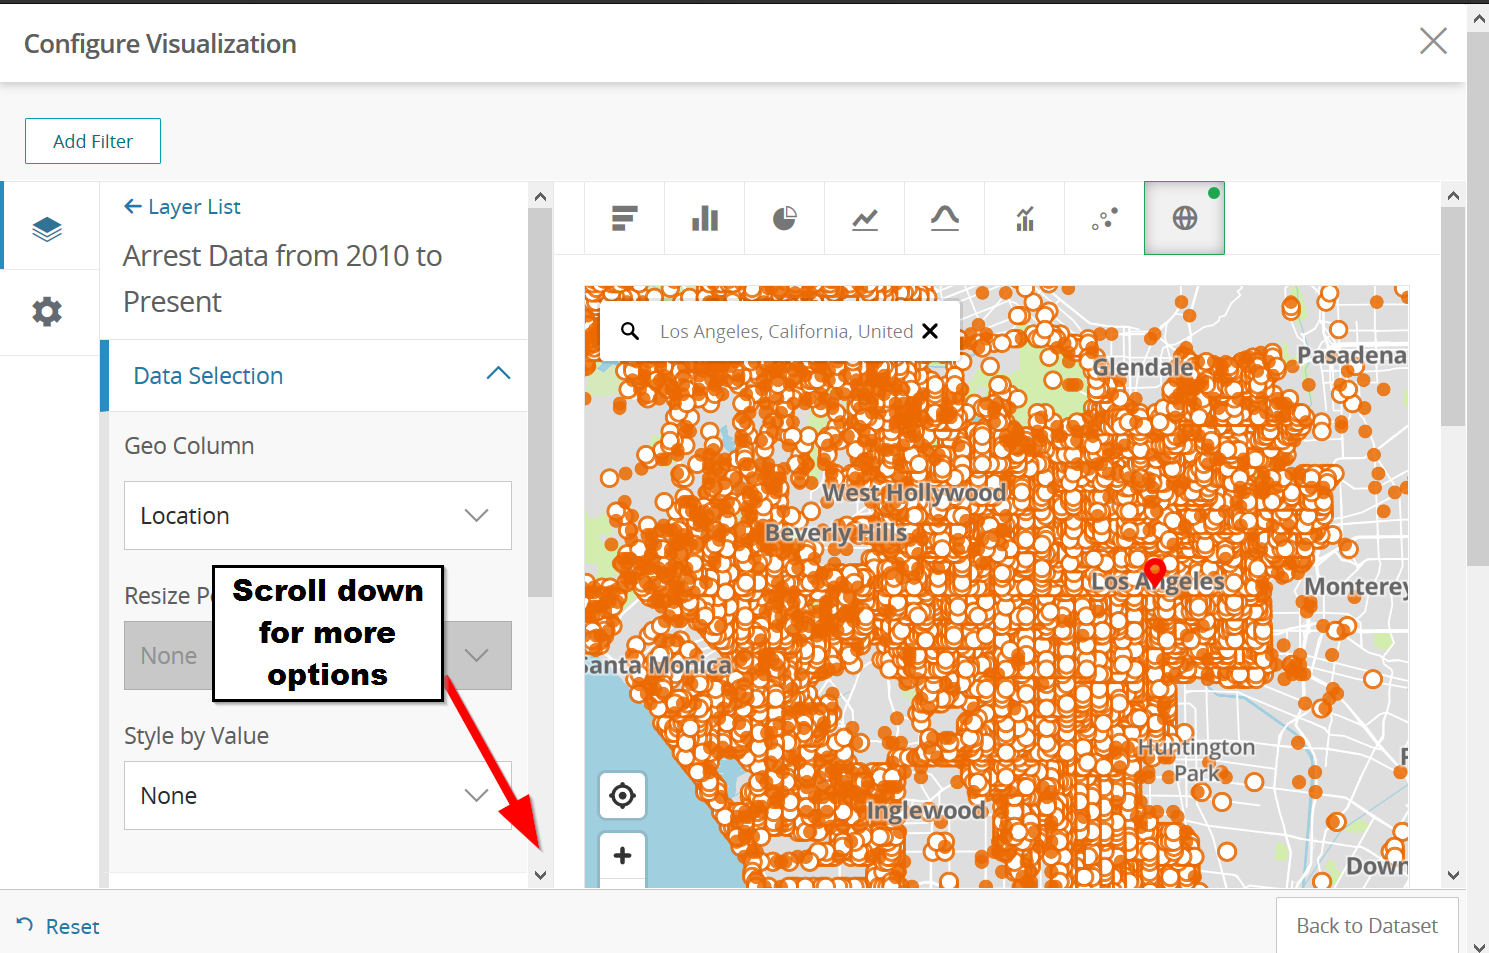
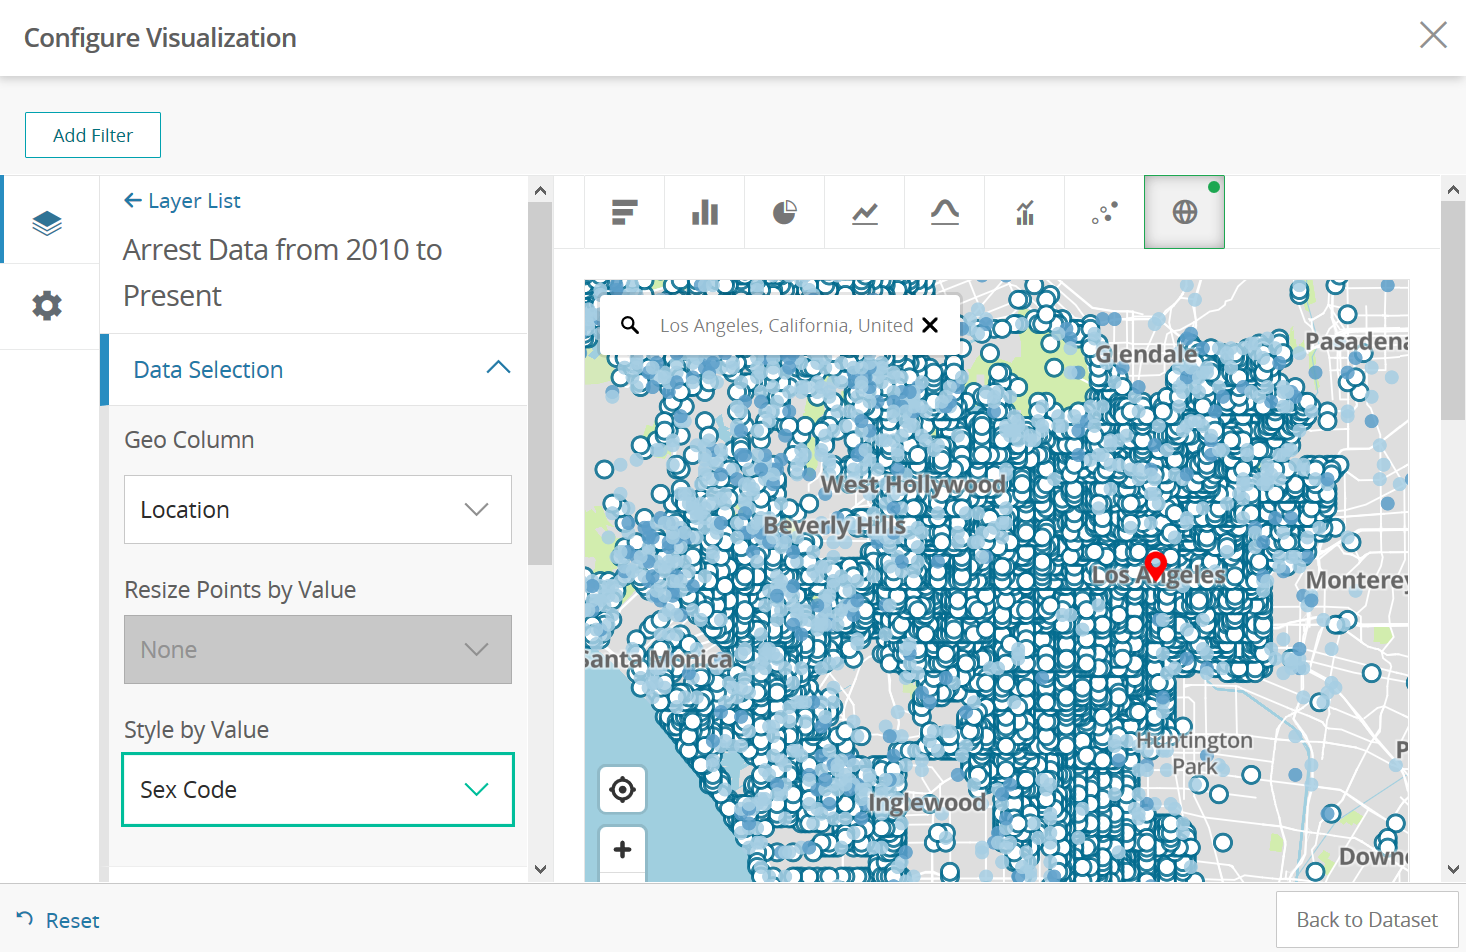
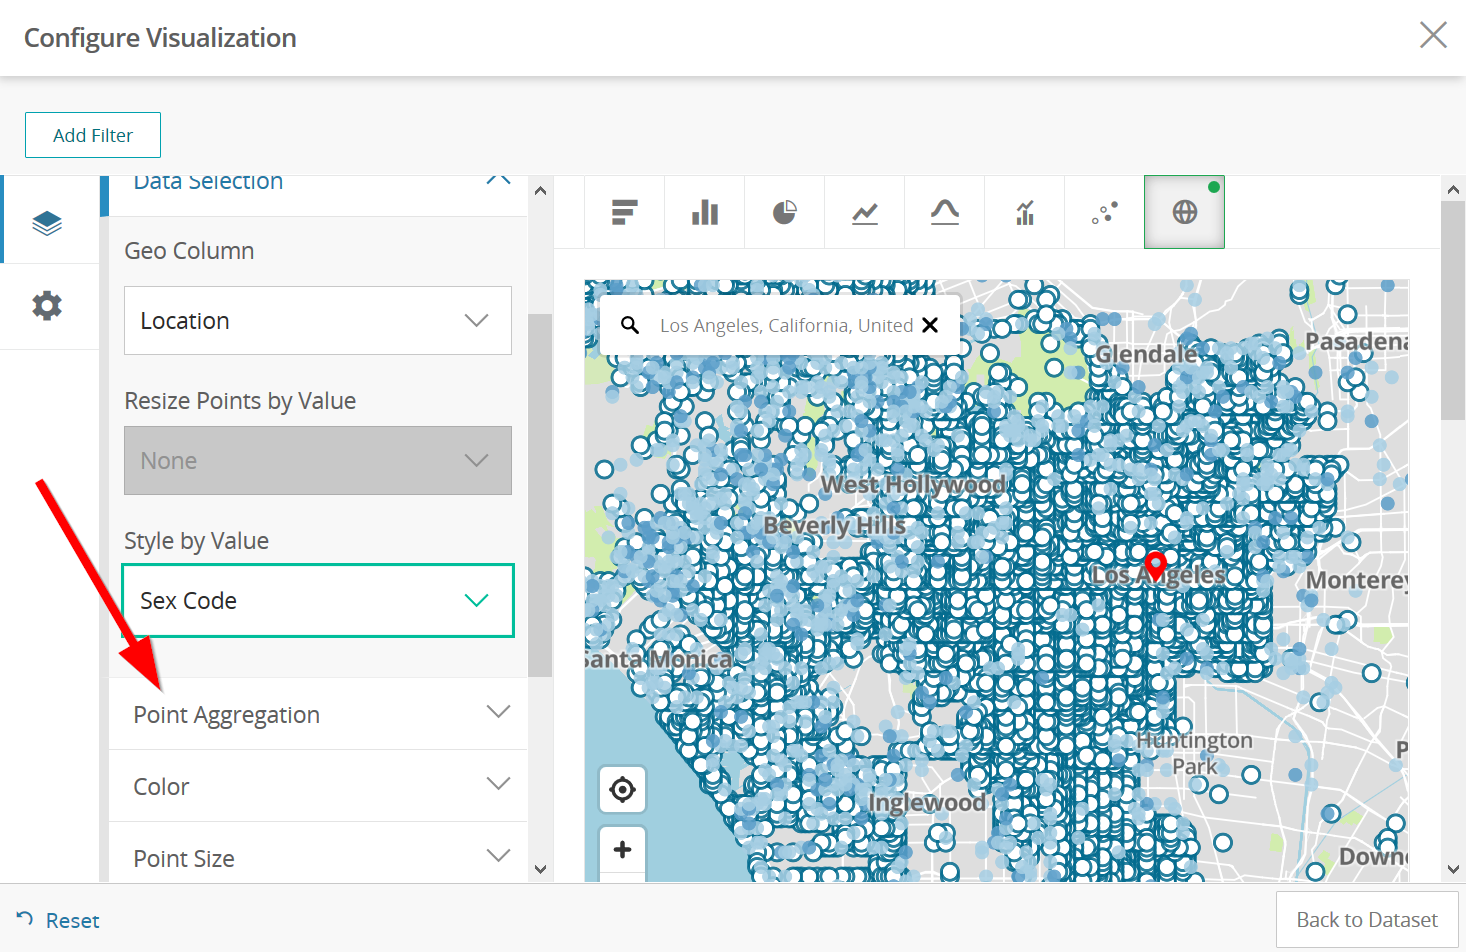
- Let’s “Style by Value” to change how our points look.
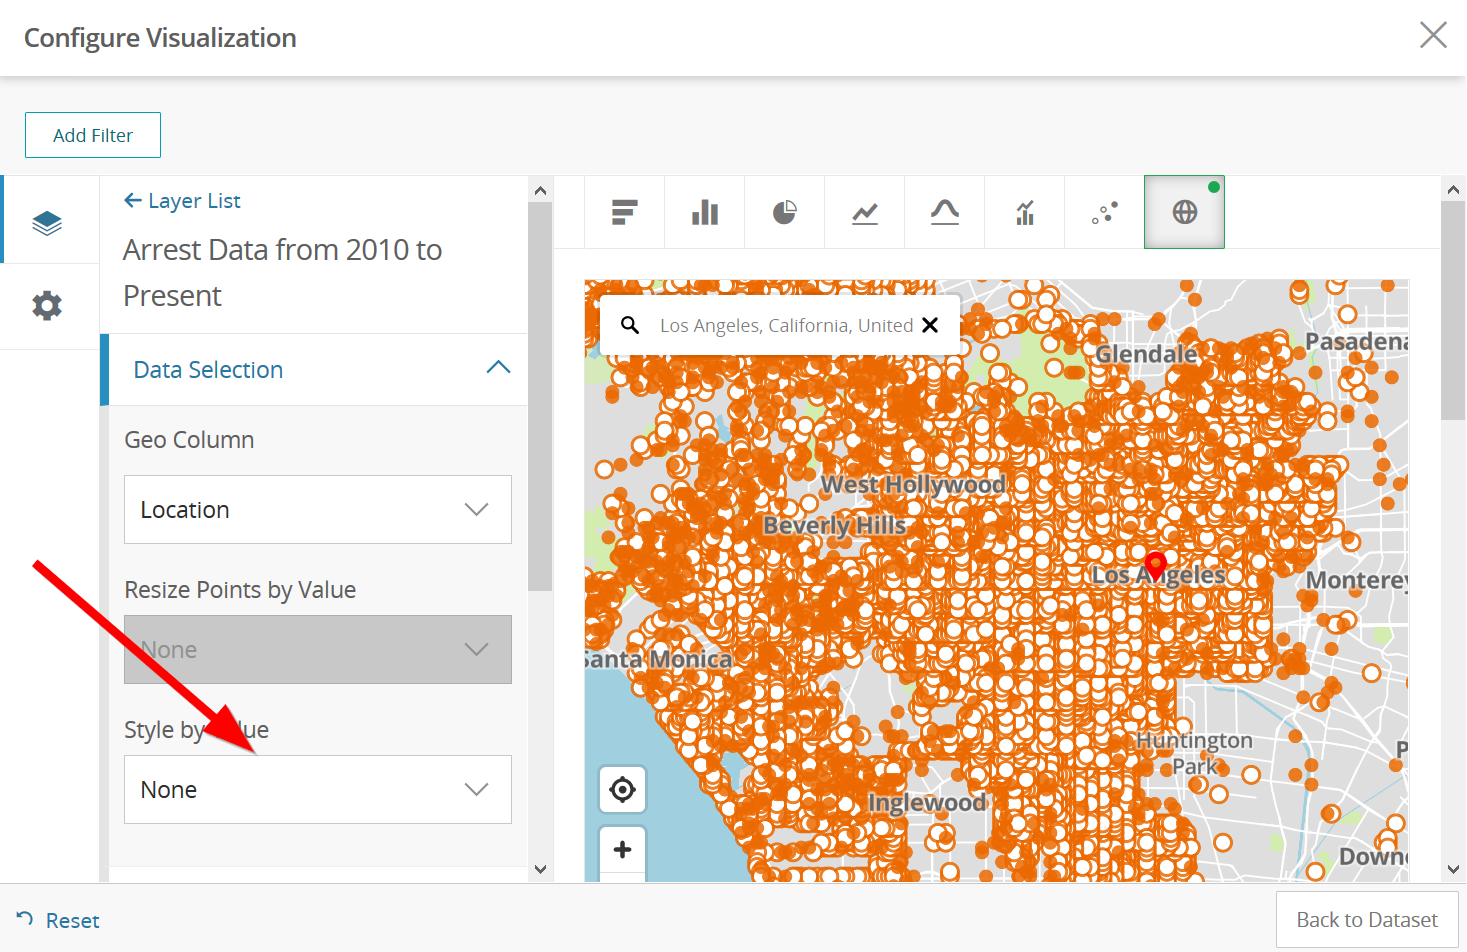
24. We will choose “Sex Code”
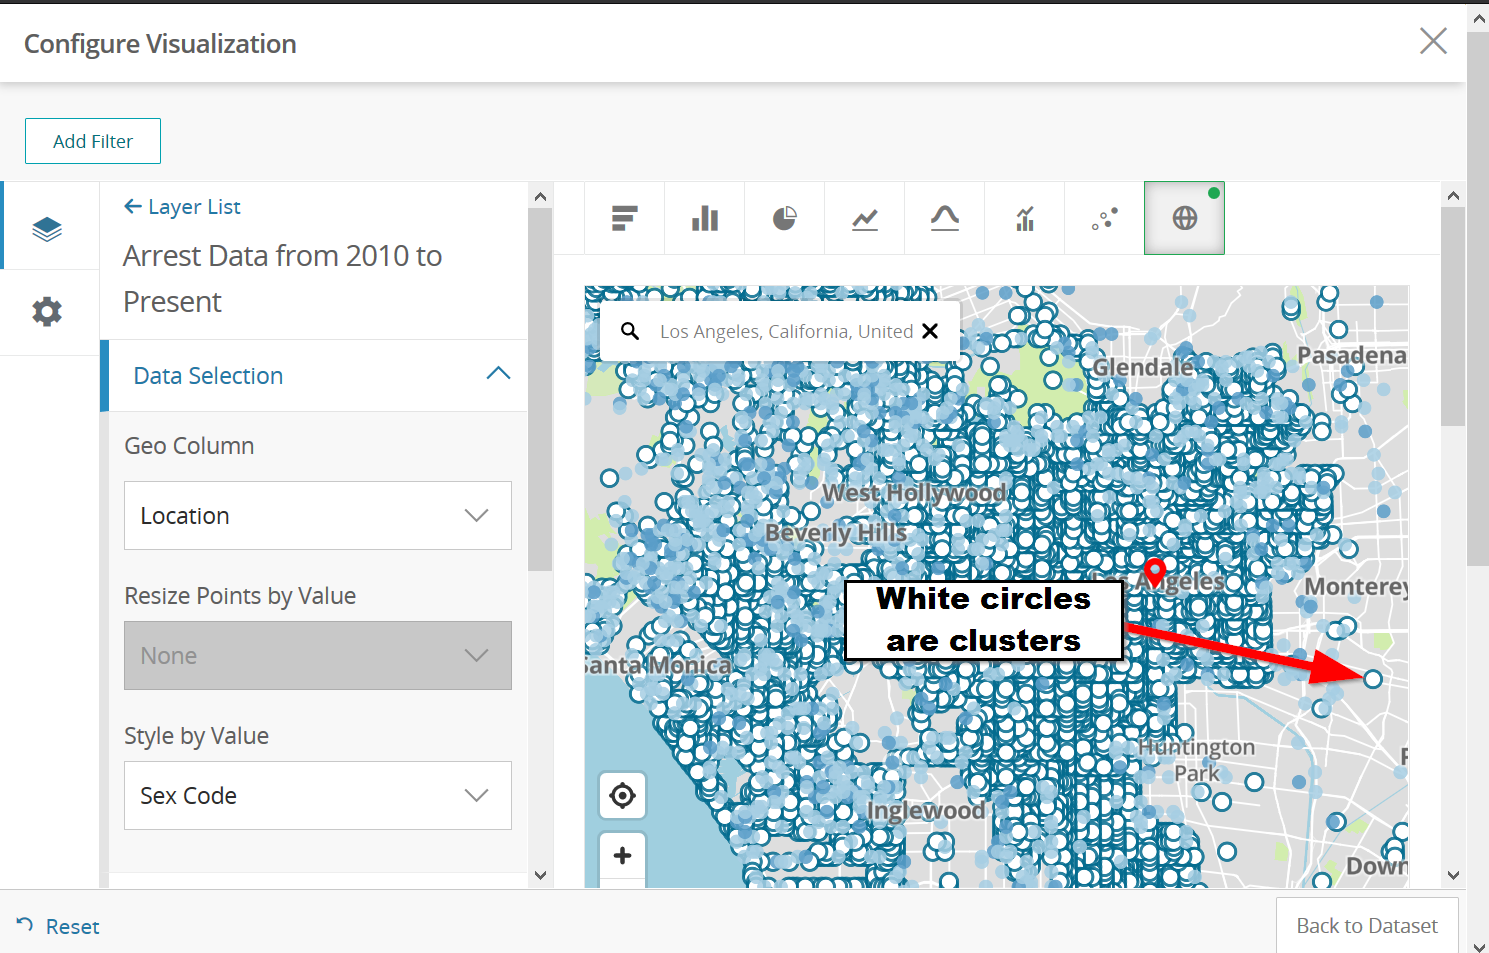
- White points are clustered points:
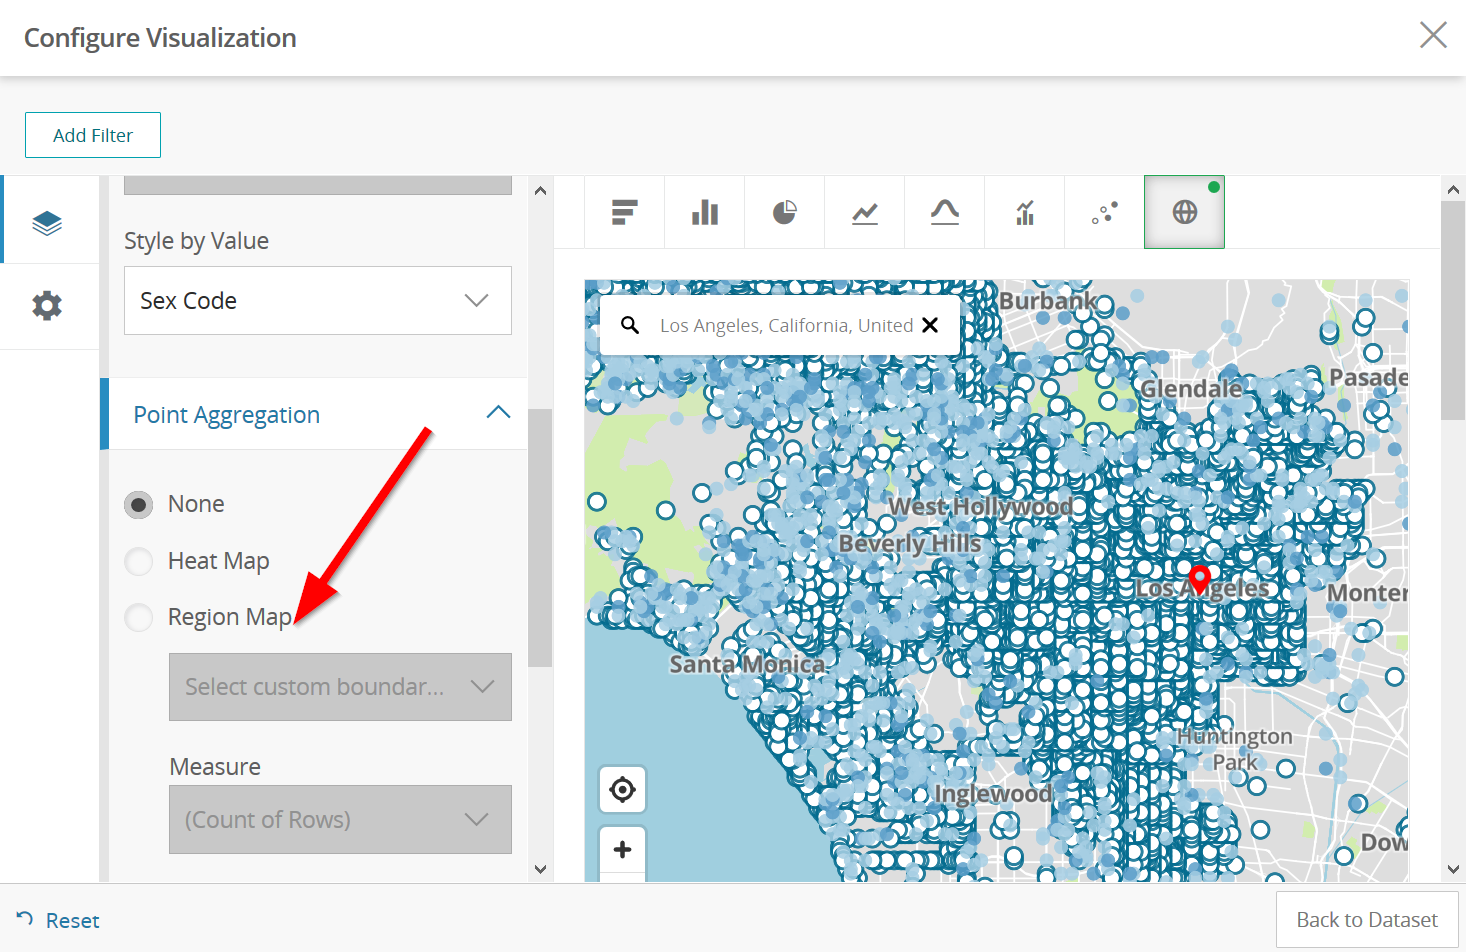
Summarizing our Map Points
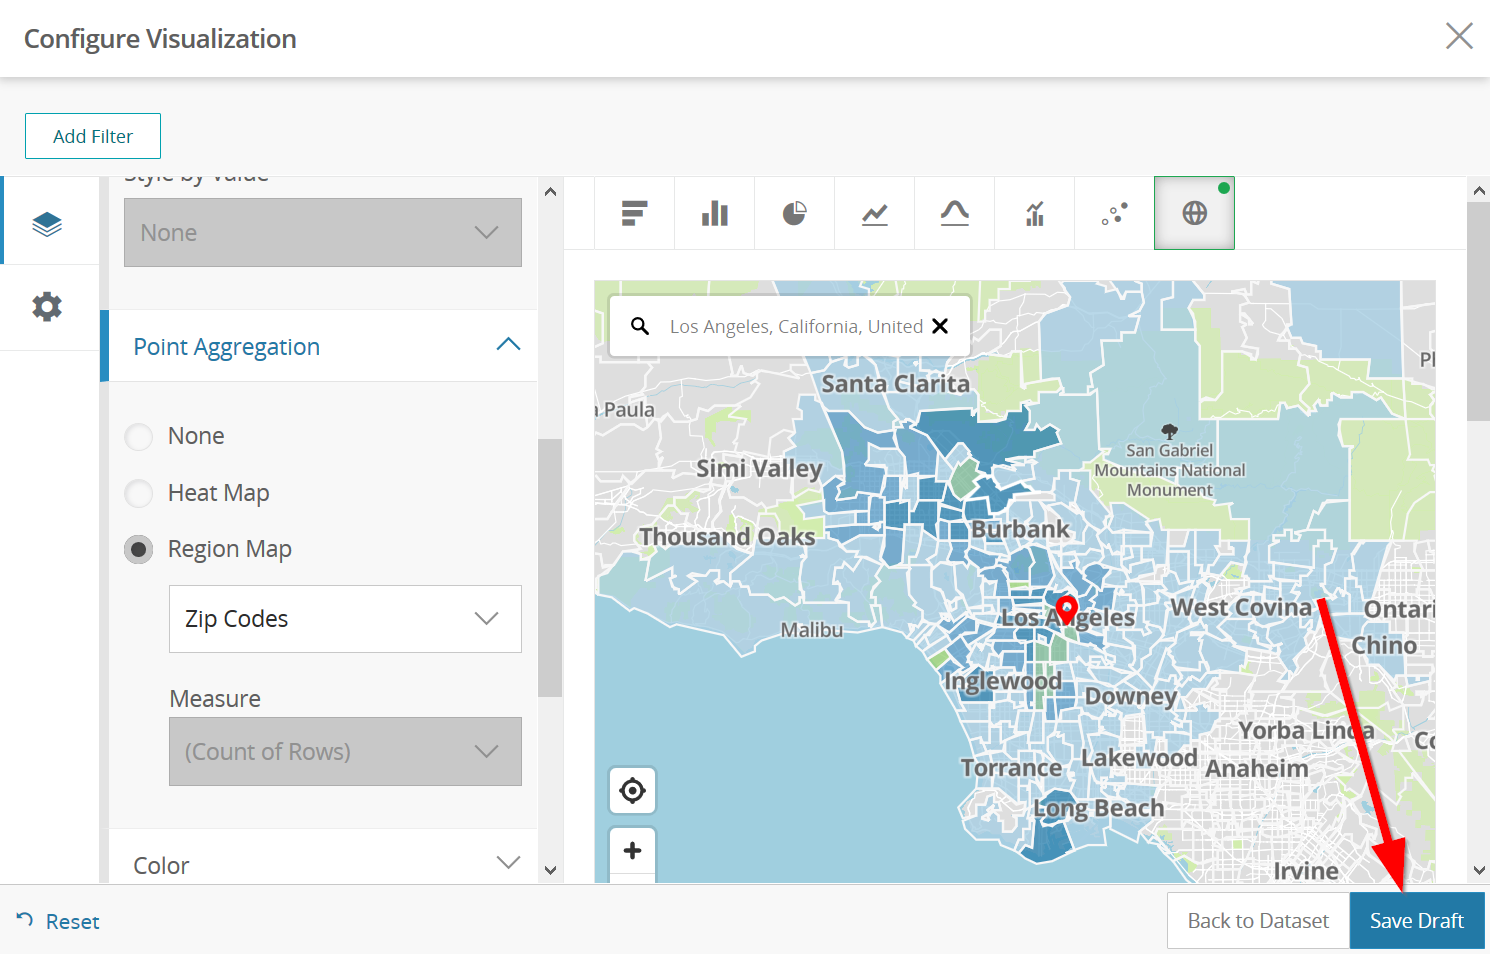
26. Scroll down to “Point Aggregation”
27. Select “Region Map”
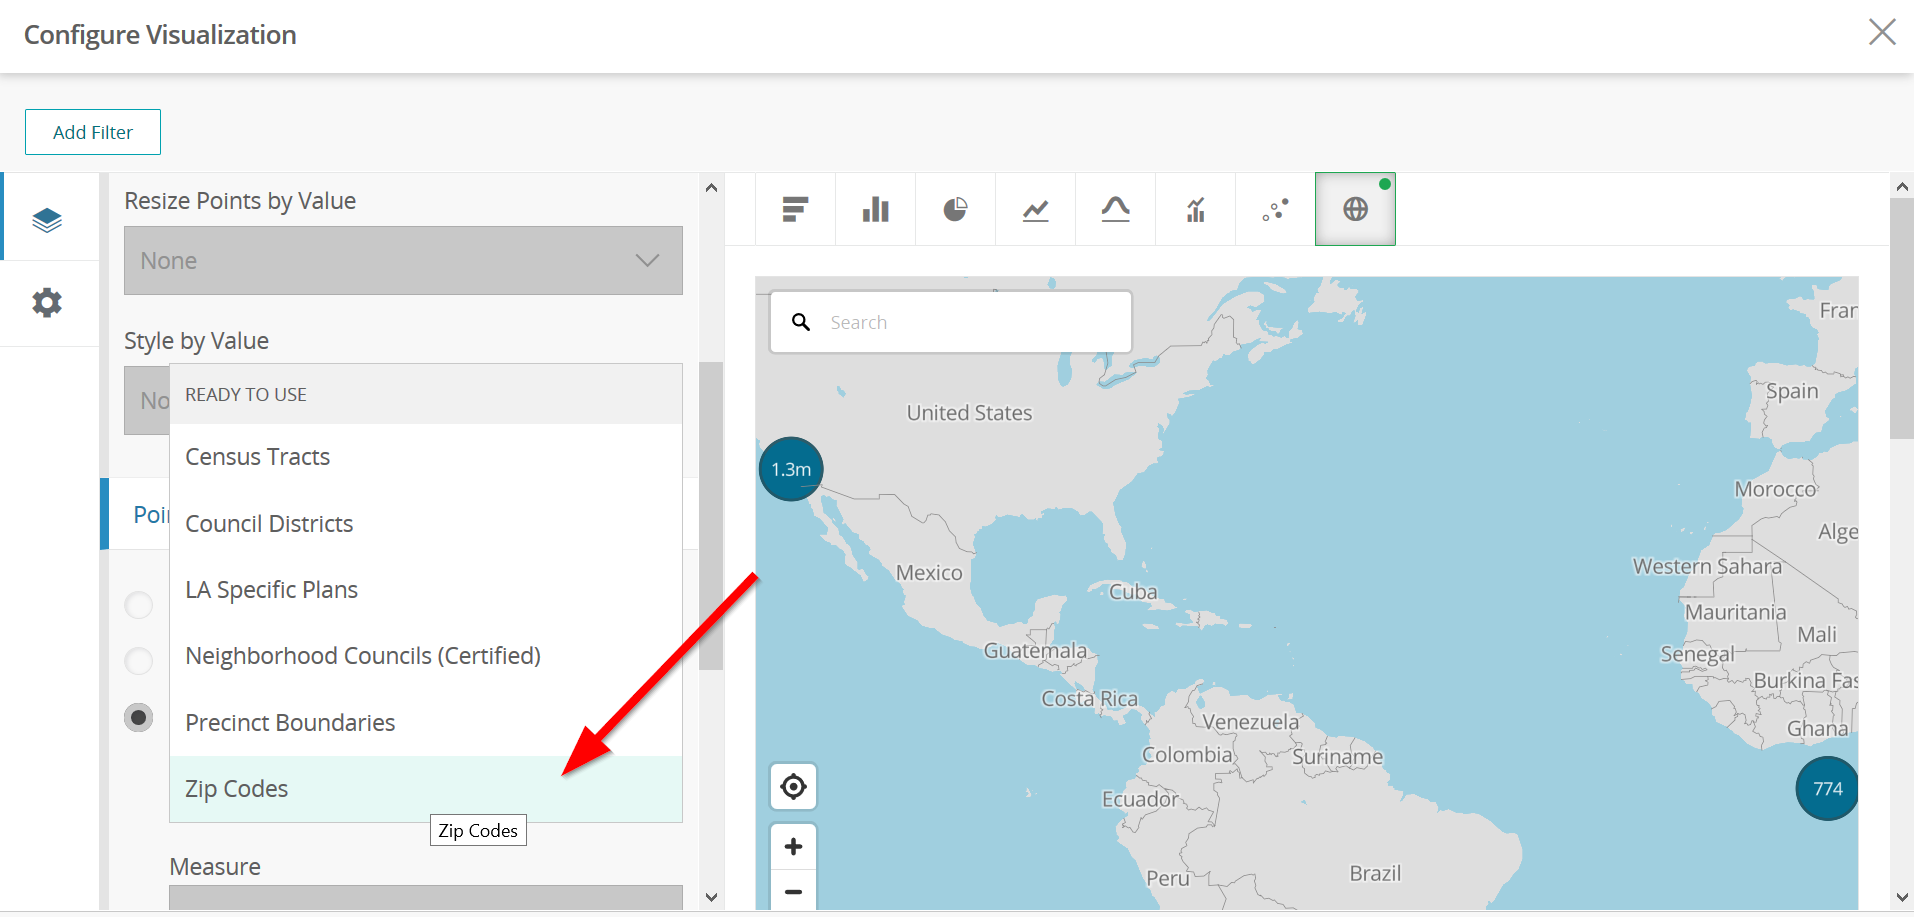
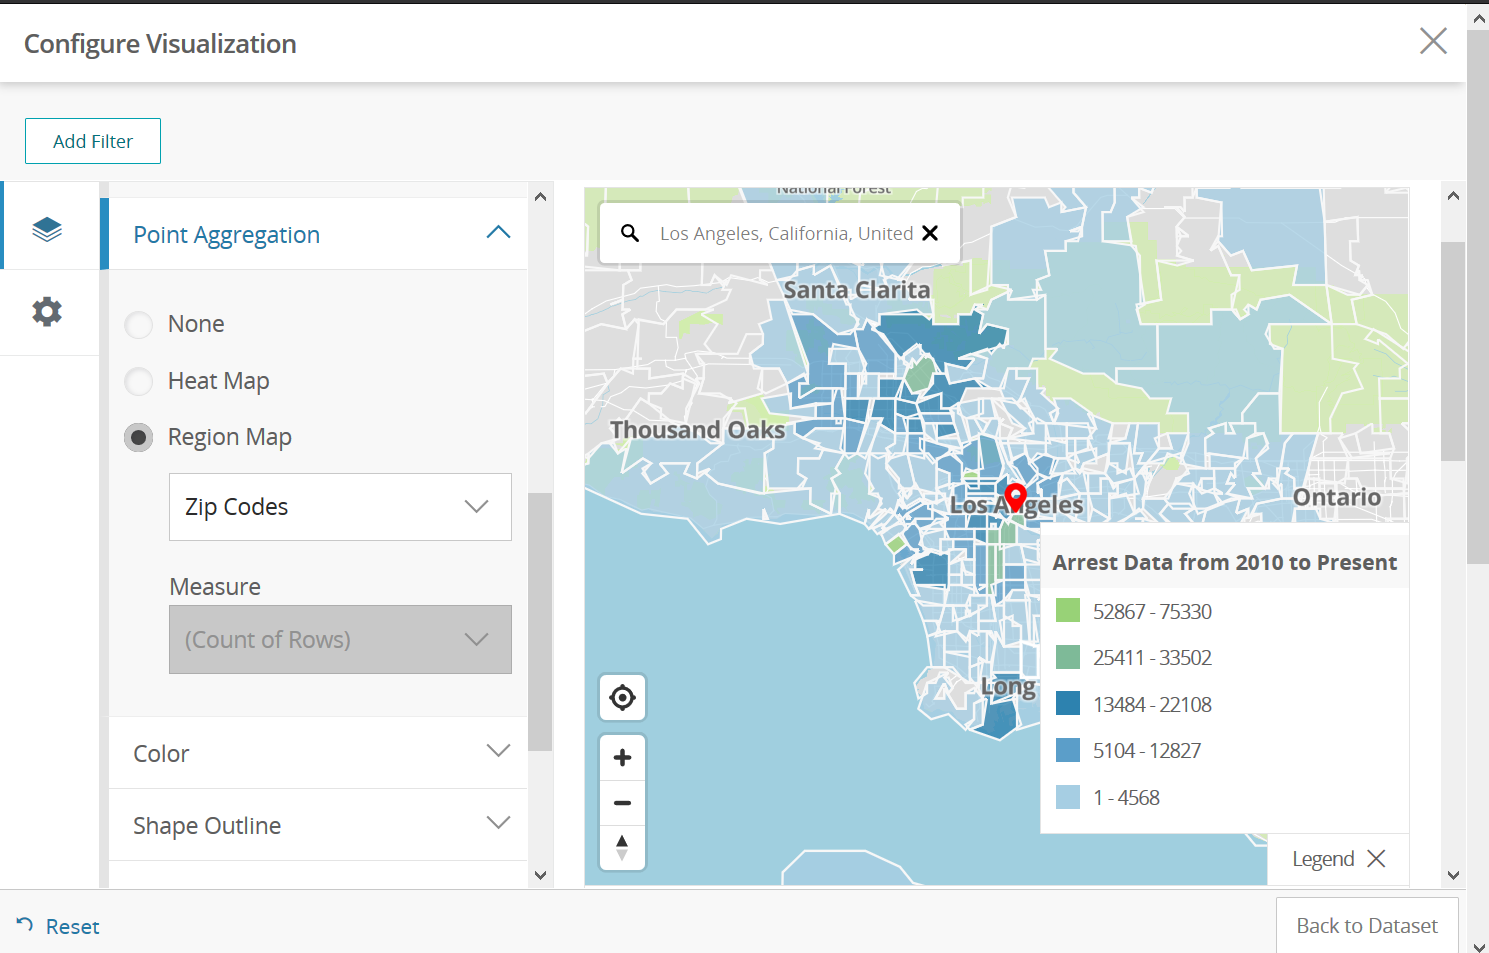
28. Choose “Zip Codes”
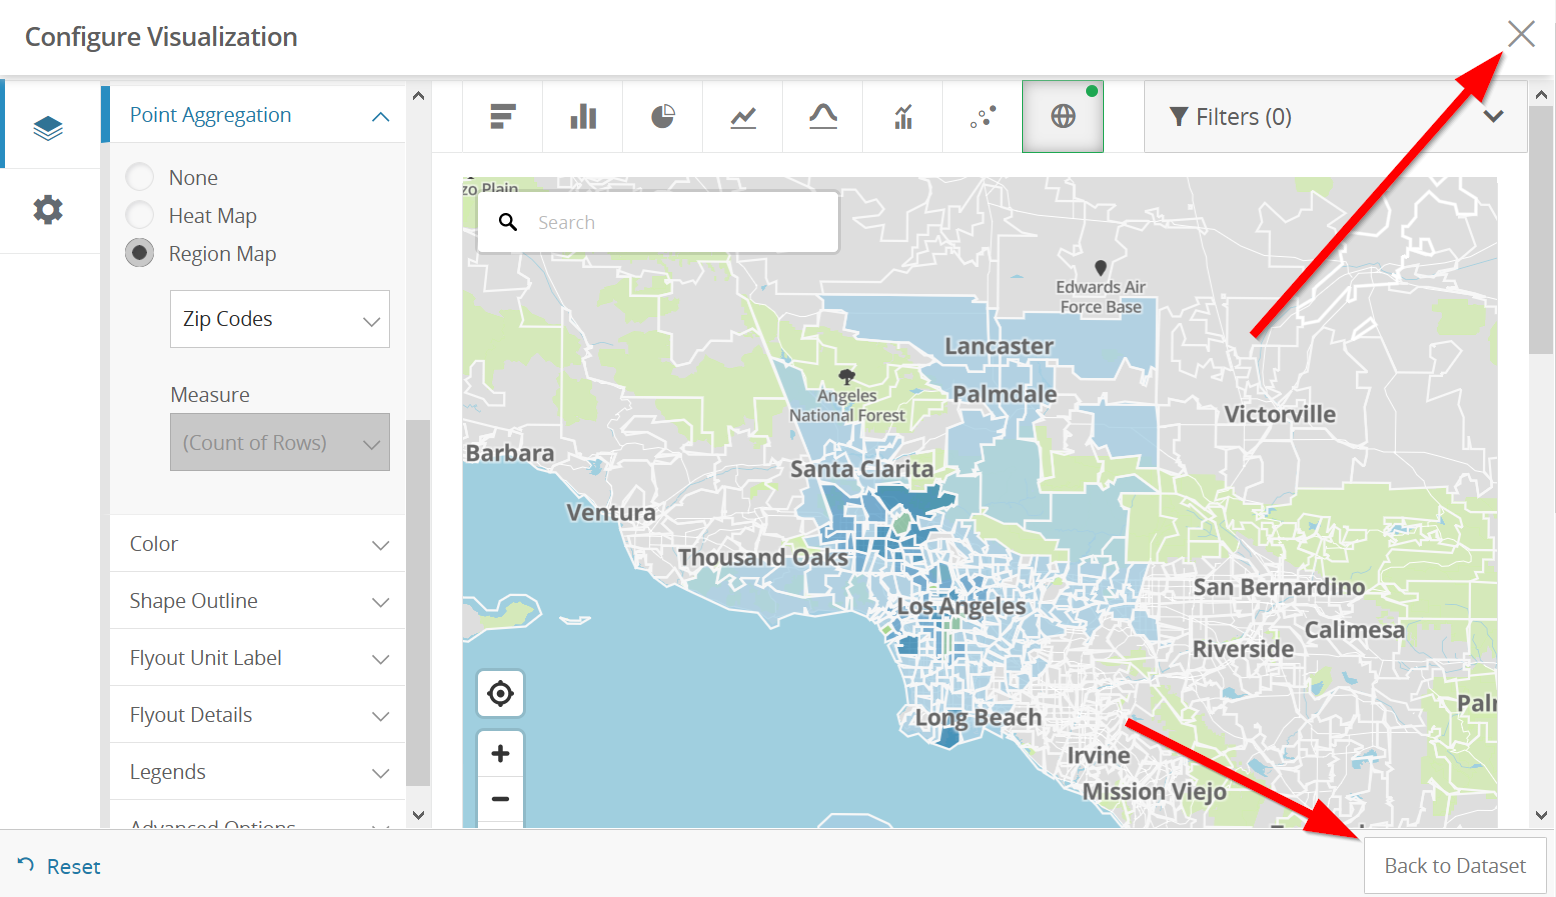
29. Zoom back to Los Angeles again, by either searching “Los Angeles” or
moving the map to there, now you can see our data by Zip Code
Save the Visualization
30. If you have created a Socrata Account, you can save the Visulization by clicking at the bottom, “Save Draft”
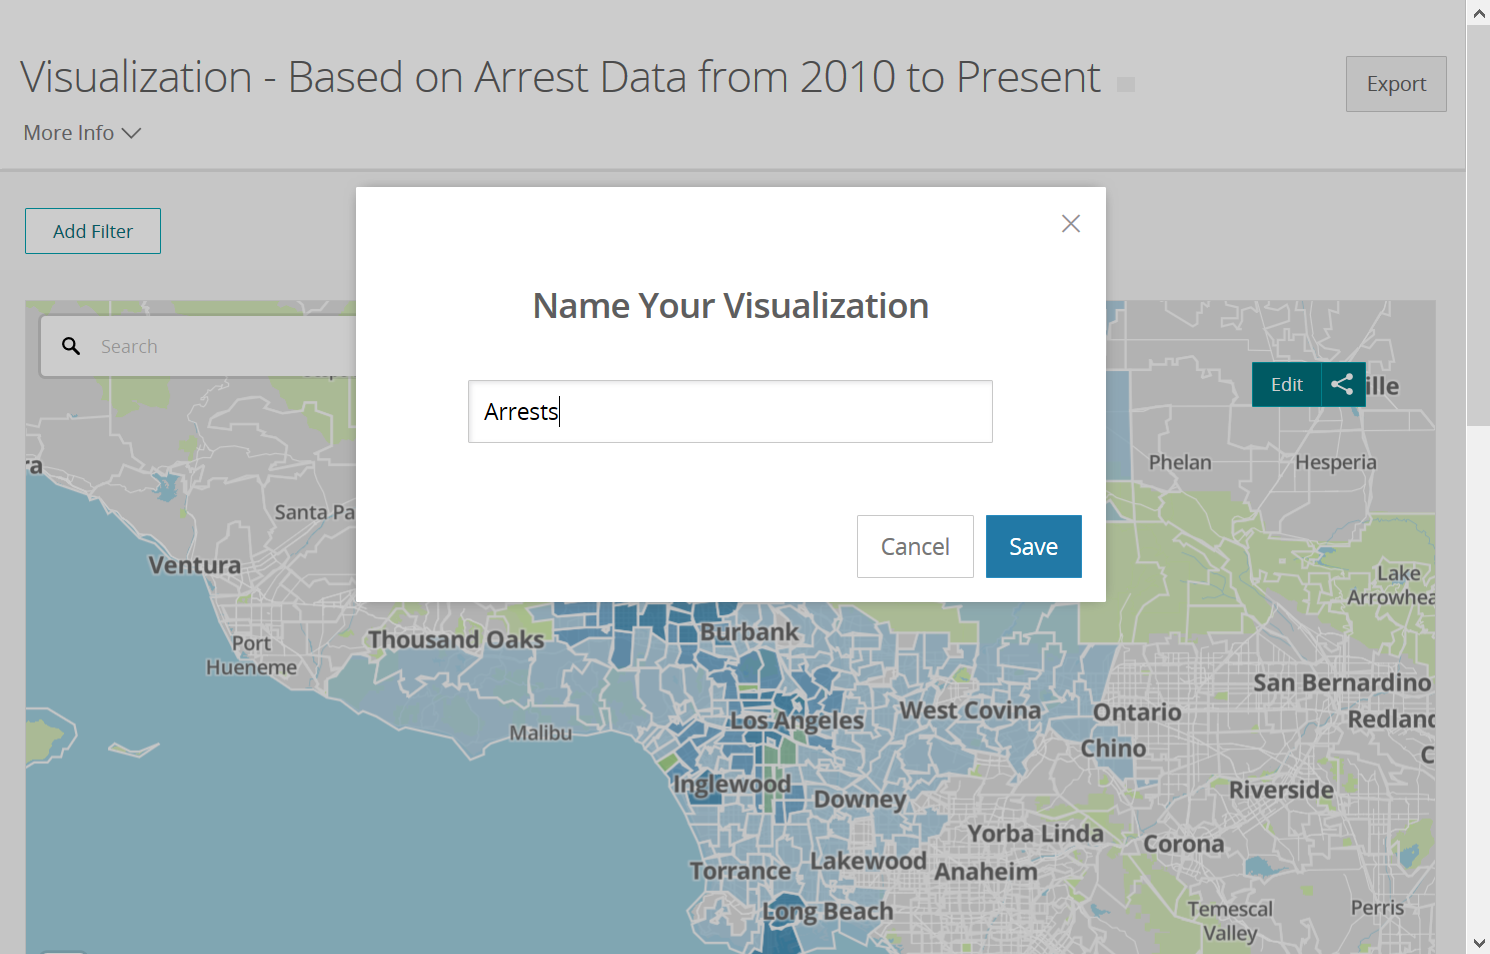
31. Give it a name and click save
32. You can now “Publish” the visualization and share it via html link. Note, you cannot save your visualization as a static image or page.
Downloading the entire data
Return back to the page with the data by clicking on the X or “Back to
Data Set”
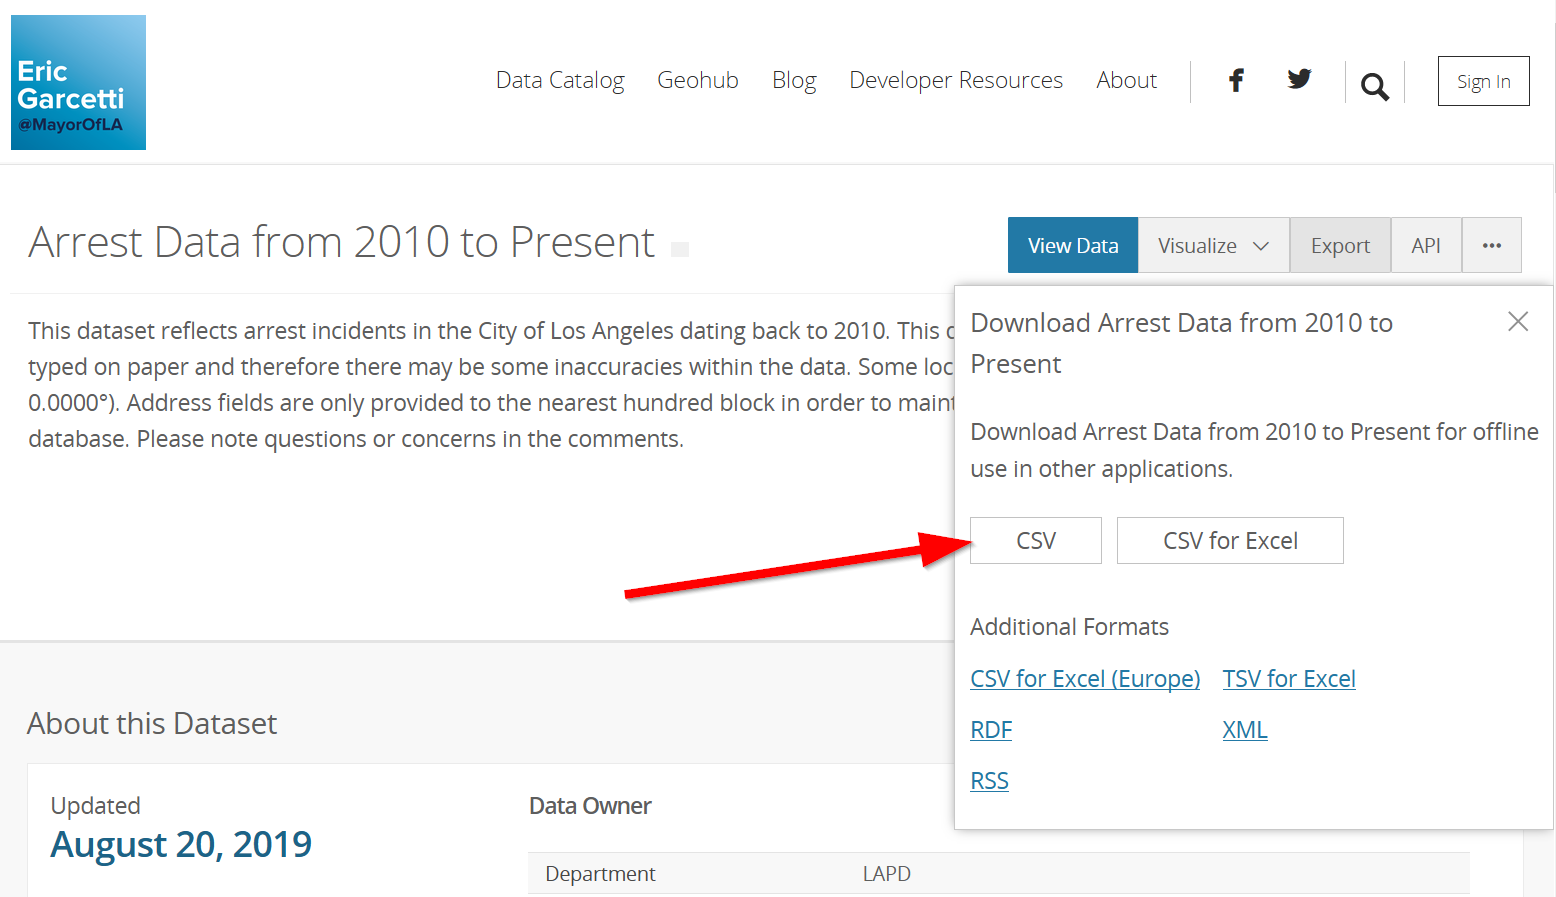
- Click on the “Export” button
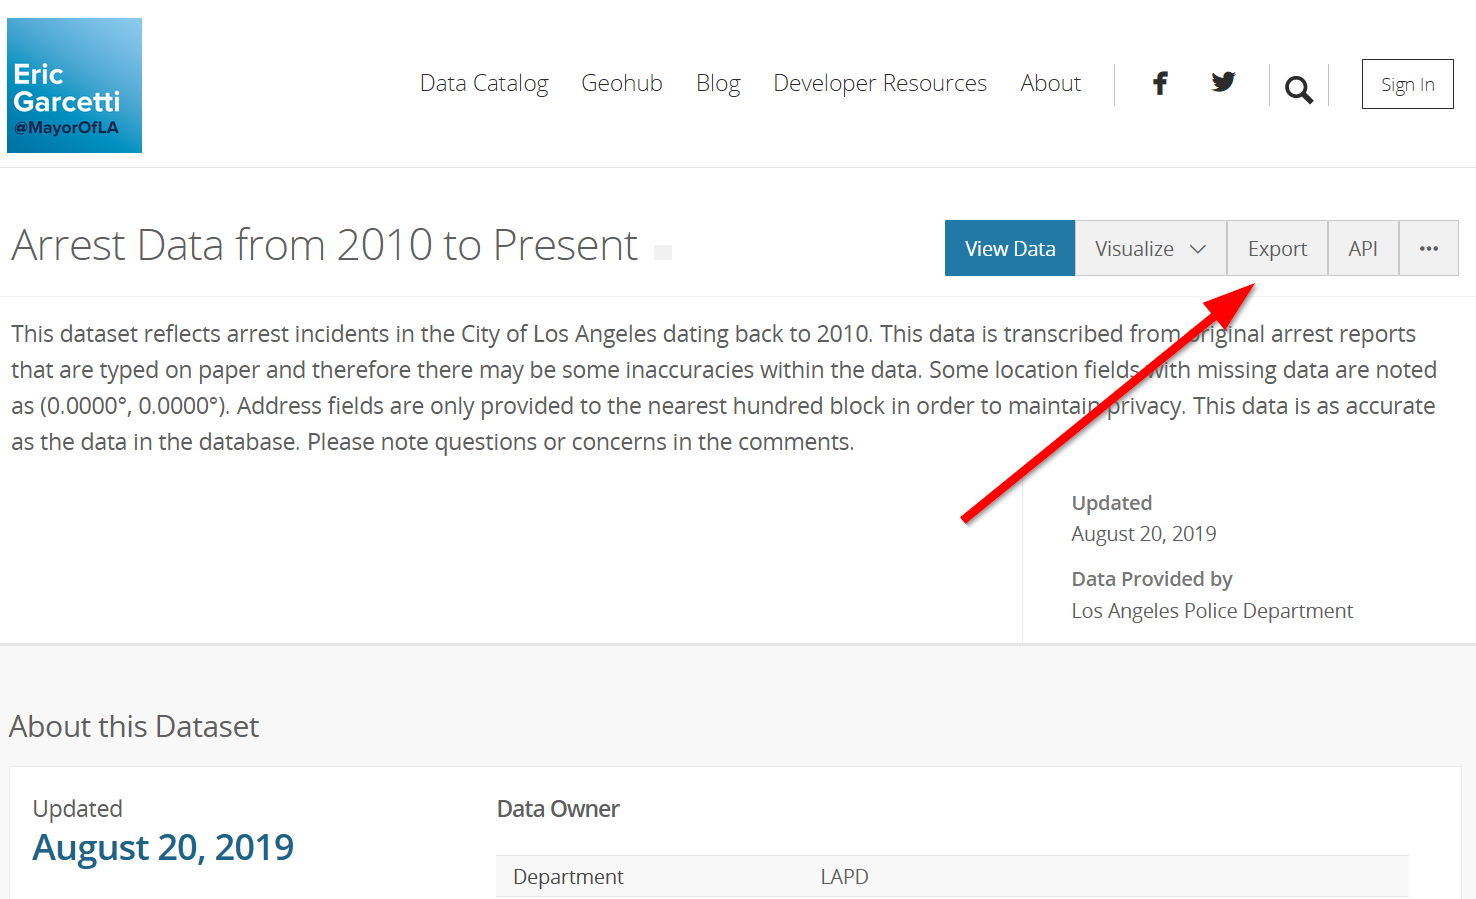
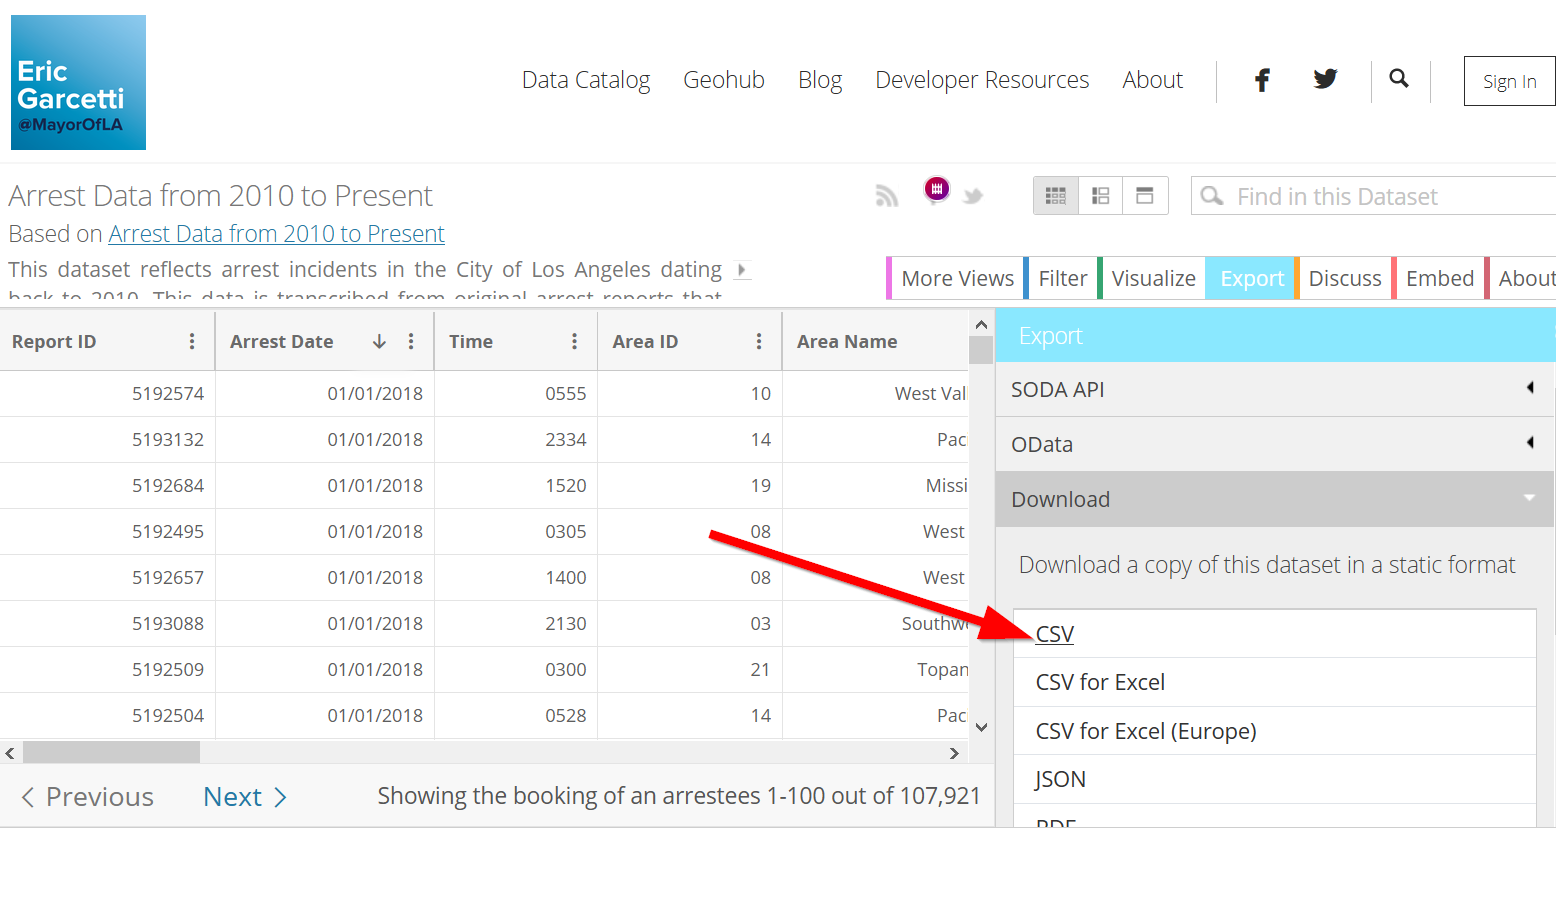
- We will choose to download the data as “CSV” which is the simplest data type:
Download filtered Data
- Go back to “View Data” to open the Socrata data page for the arrest dataset:
- Click on “Filter” to filter the data:
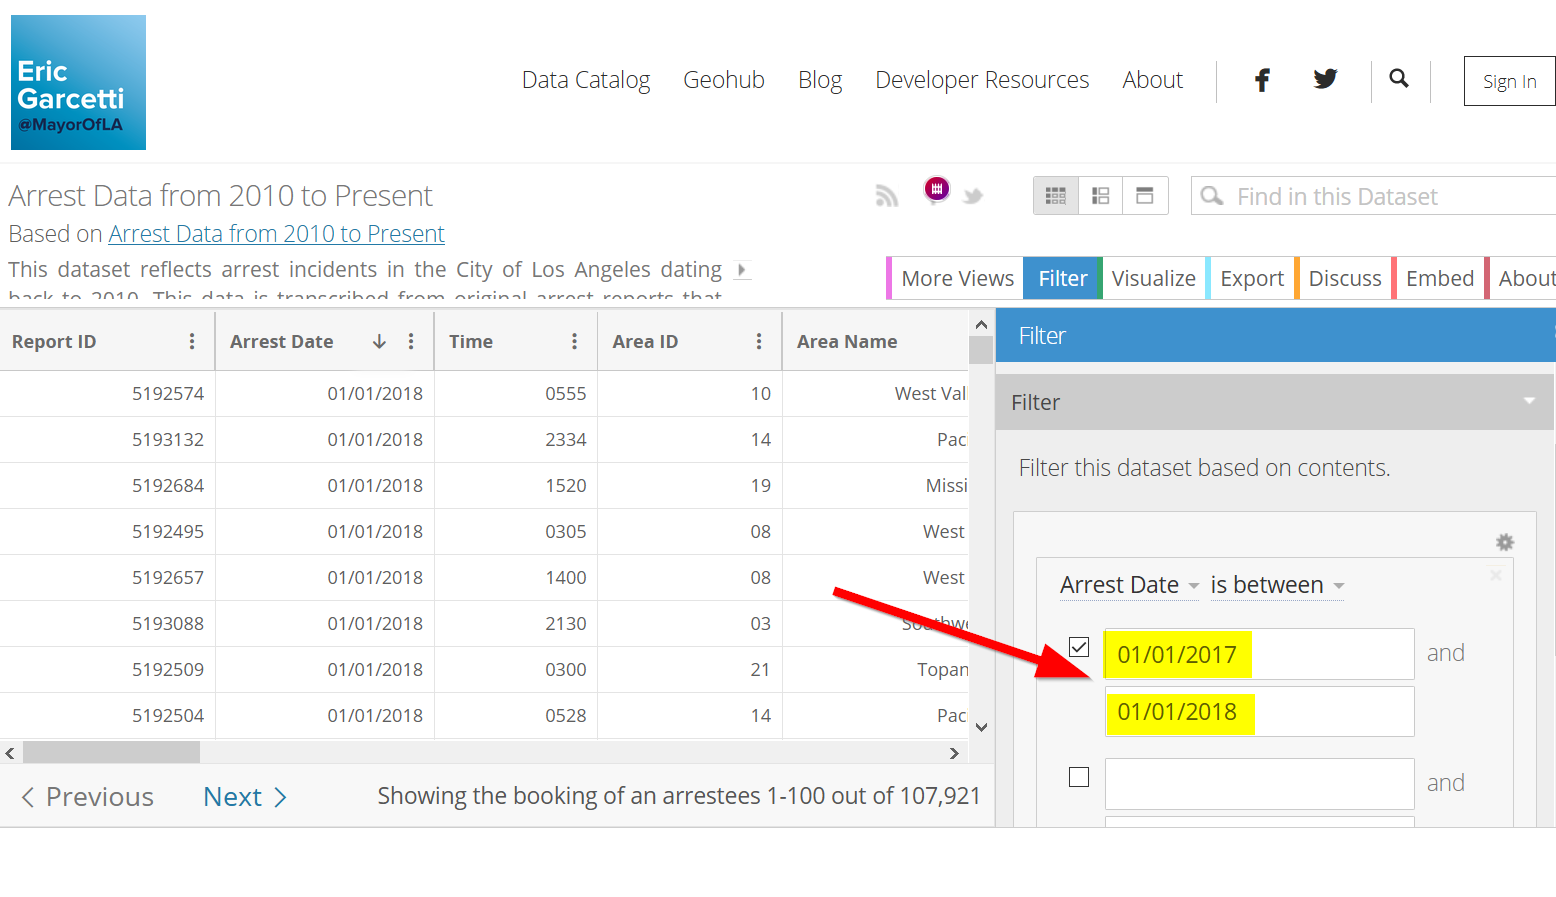
37. Let’s only get data for 2017 to 2018, click on “Age”(1) and then choose “Arrest Date” (2):
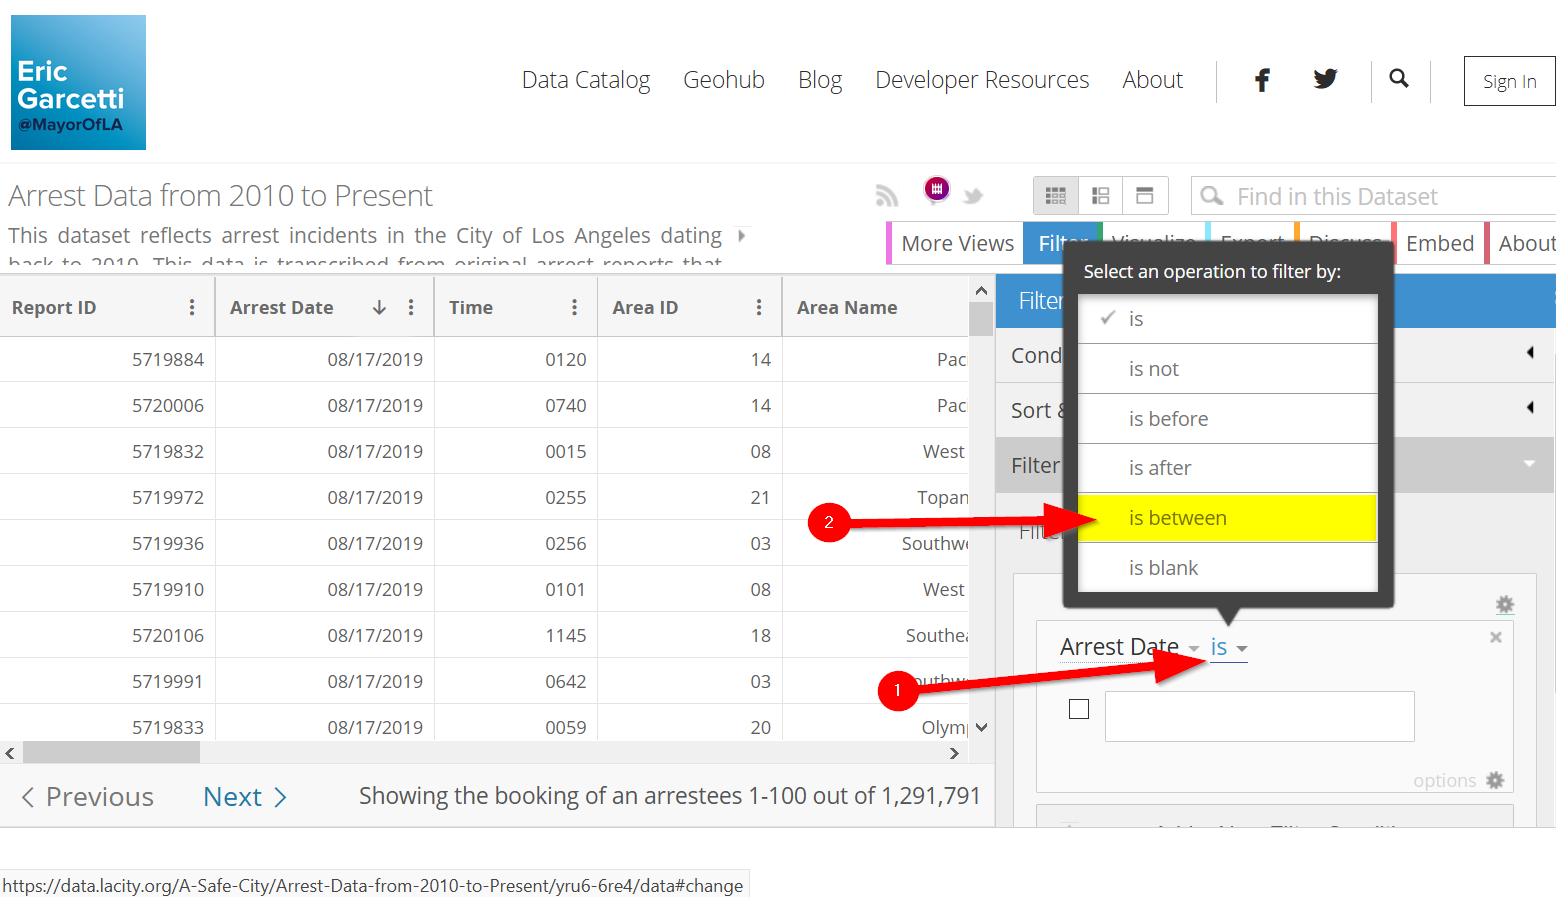
- Next, select “is” (1) and choose “is between” (2):
- Choose the dates on the calendar (or type in “01/01/2017” and “01/01/2018”) :
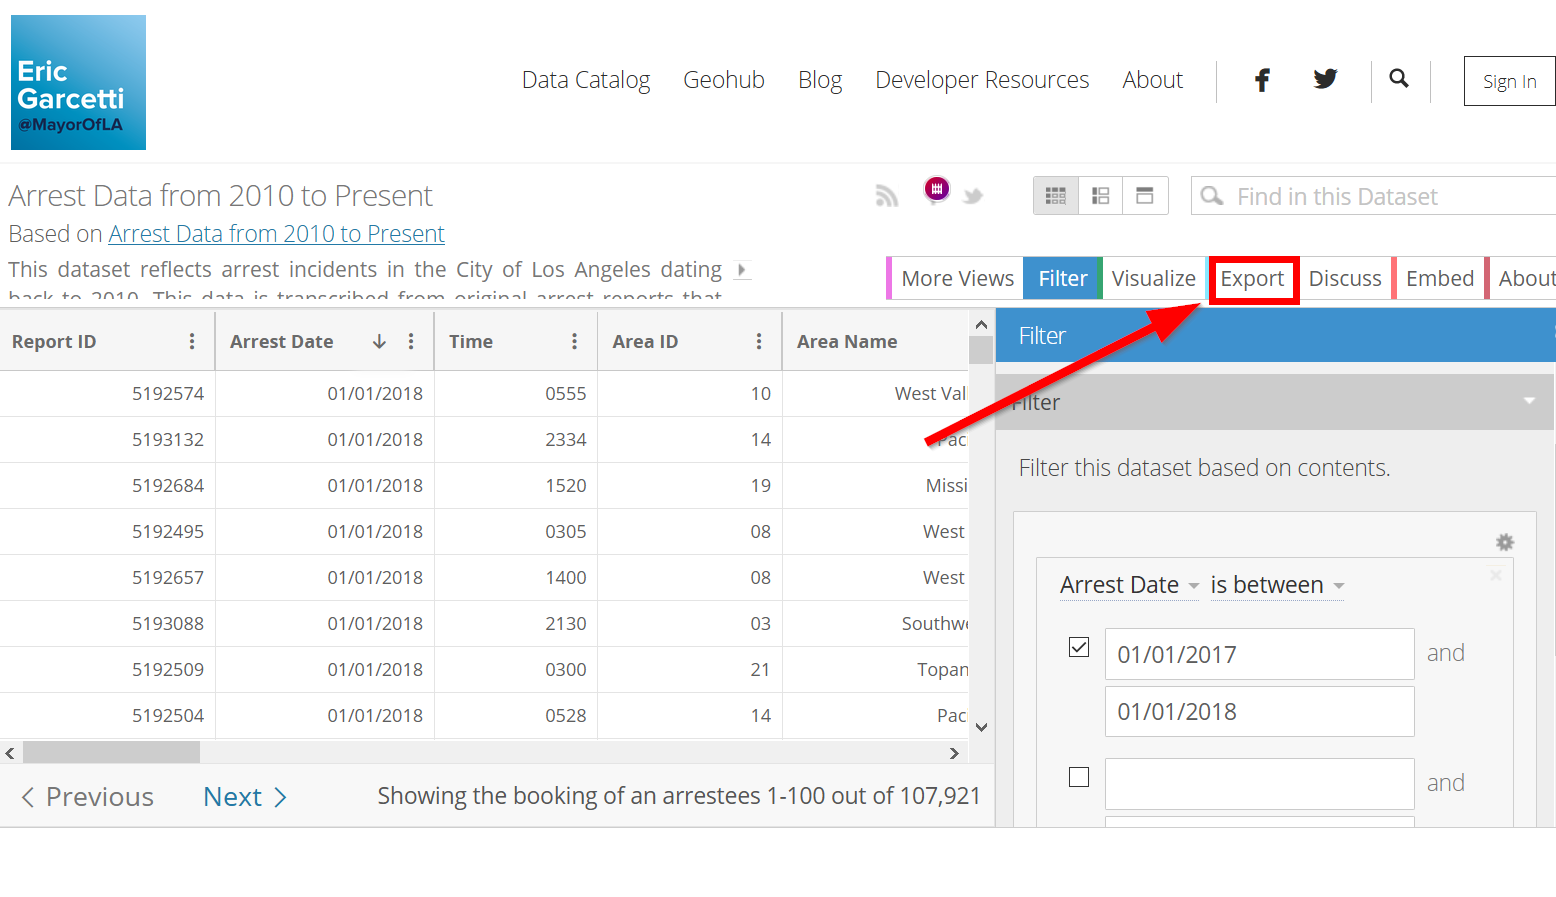
- Click on “Export”
- Choose “CSV”
- Congratulations! You can now work with the data in other applications!